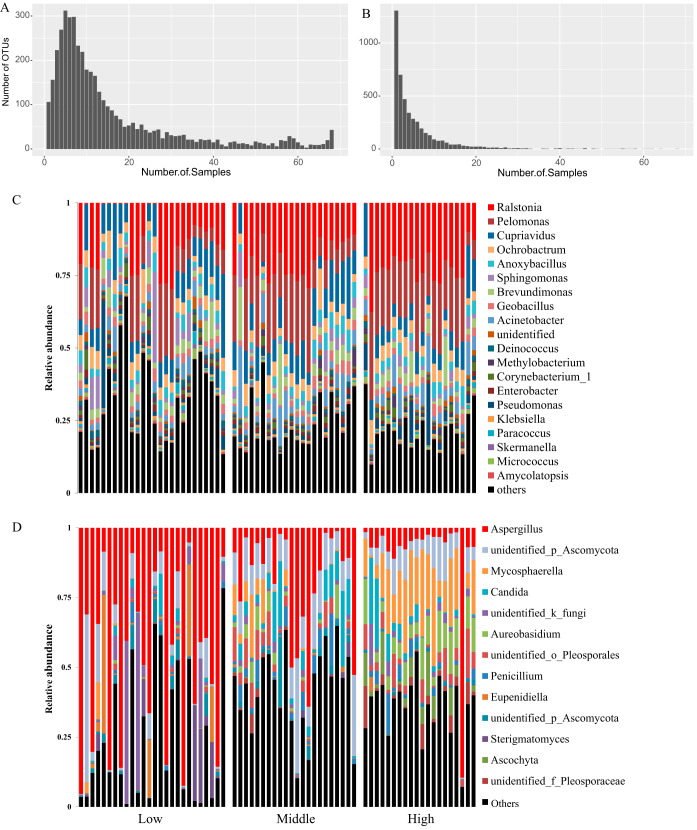
FIG 2.
Distribution and relative abundance of bacterial and fungal taxa in hotels. (A and B) Frequency spectra for the number of bacterial (A) and fungal (B) OTUs in samples. (C and D) Relative abundances of top bacteria (C) and fungi (D) at the genus level for all samples. Hotels in low, middle, and high latitudes were placed in the left, middle, and right parts along the x axis.

