FIG 6.

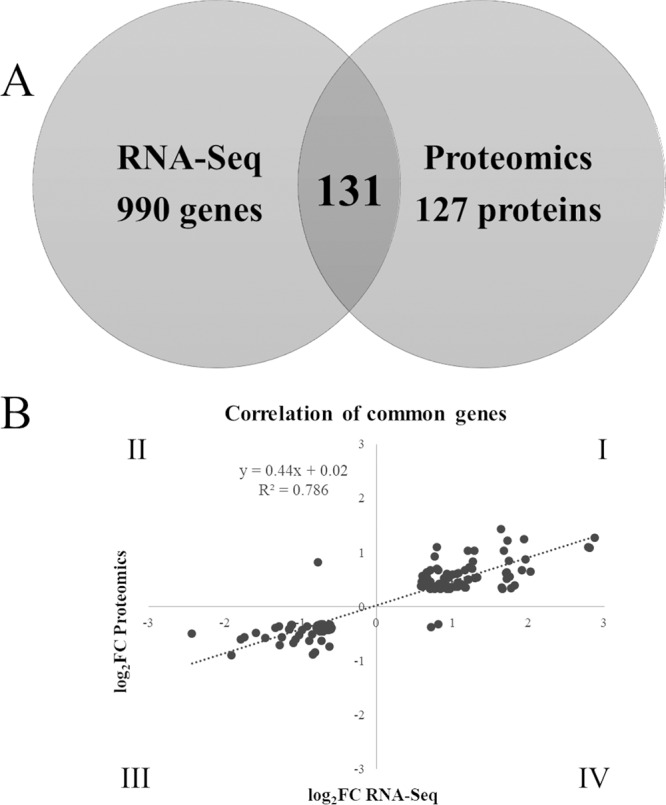
Comparison of RNA-Seq and proteomics data. (A) Venn diagram showing unique and common genes and proteins between the two methods; (B) scatterplot showing log2 FC values for the common genes and proteins.

Comparison of RNA-Seq and proteomics data. (A) Venn diagram showing unique and common genes and proteins between the two methods; (B) scatterplot showing log2 FC values for the common genes and proteins.