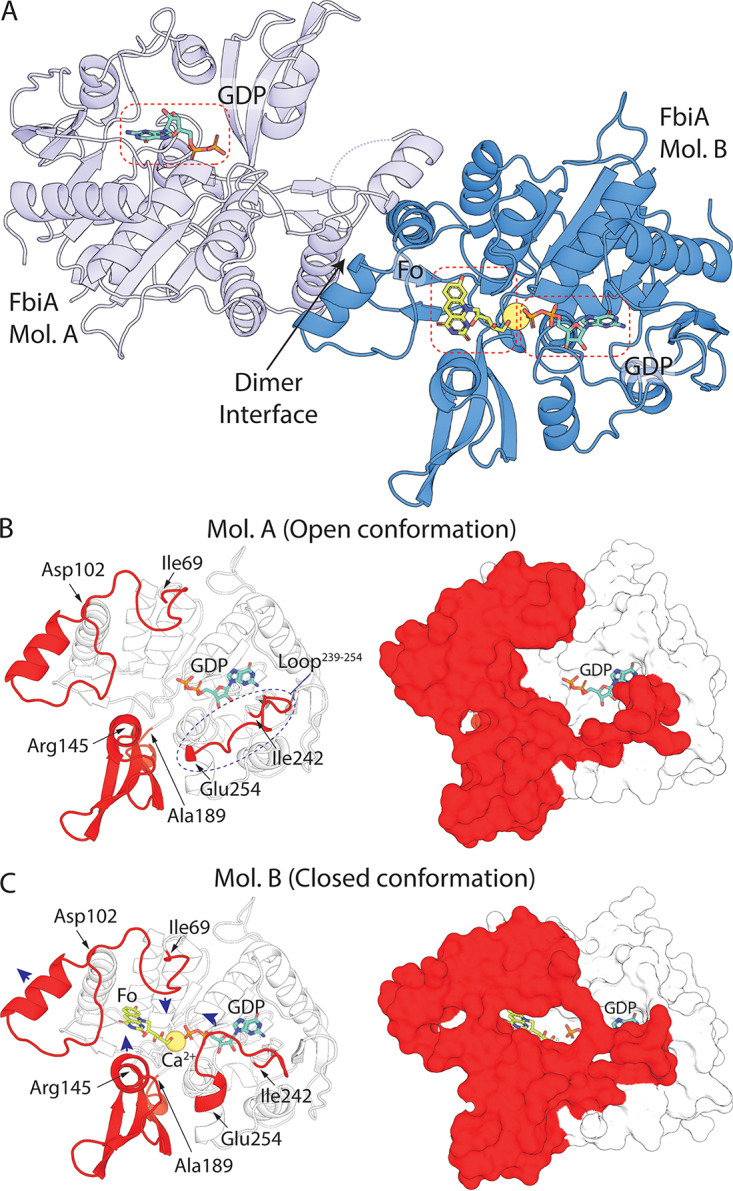
FIG 3.

The crystal structure of FbiA captures the enzyme in open and closed states. (A) The crystal structure of FbiA from M. smegmatis in complex with Fo and GDP. FbiA is shown as a cartoon representation with molecule B (Mol. B) in sky blue and Mol. A in light blue. GDP and Fo are shown as stick representations, and Ca2+ is shown as a yellow sphere. (B) Mol. A from the FbiA structure exists in an open conformation. (Left) Mol. A as a cartoon with loops and subdomains which differ in conformation in Mol. B highlighted in red. (Right) Mol. A as a surface representation with mobile regions highlighted in red. (C) Mol. B of FbiA structure exists in a closed “catalytically ready” state. (Left) Mol. B displayed as in panel B, with the direction of movement of loops compared to Mol. A shown with blue arrows. (Right) Mol. B as in panel B, demonstrating how the mobile regions enclose the FbiA active site.
