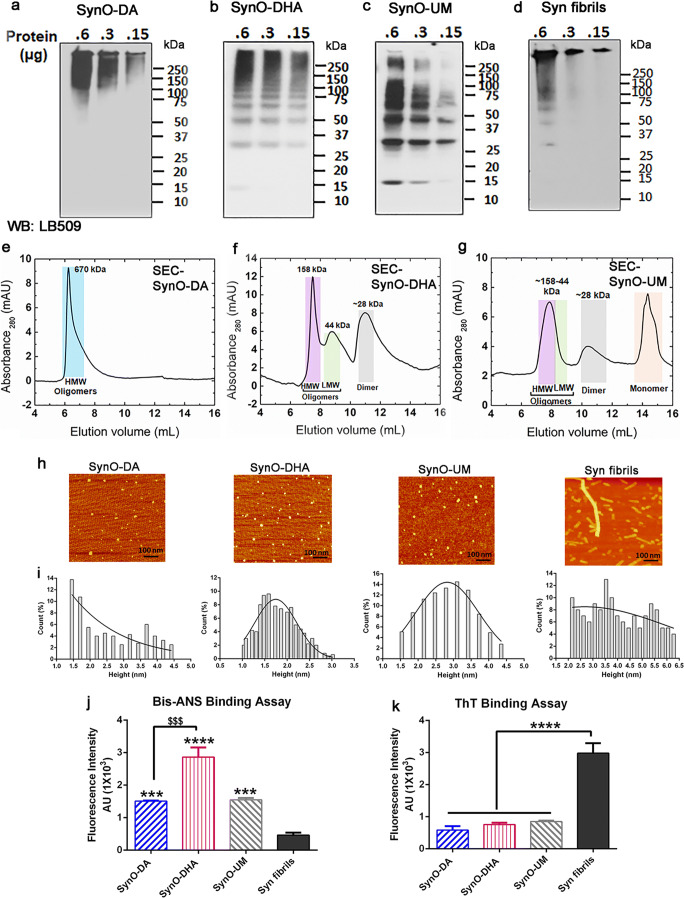
Fig. 2.
Biochemical characterization of DA- and DHA-modified α-Syn oligomers. a–d Representative WB images of the indicated amounts of the four different α-Syn aggregates probed with a generic α-Syn antibody LB509. e–g Size exclusion chromatograms (SEC) of the three oligomers showing different sizes of aggregates. SynO-DA shows more homogeneous aggregates with a single peak, whereas SynO-DHA shows multiple peaks corresponding to different sizes of aggregates. HMW = high molecular weight, LMW = low molecular weight. h, i Representative AFM images of α-Syn aggregates and their height distribution chromatograms. All three oligomer preparations show spherical structures, whereas Syn fibrils show protofilaments. j Fluorescence intensity measurement of bis-ANS binding to α-Syn aggregates shows significantly strong binding to all the three α-Syn oligomers compared to Syn fibrils. SynO-DHA shows strongest binding intensity with bis-ANS than the other two oligomer preparations. k Fluorescence intensity measurement of ThT binding to α-Syn aggregates. ThT binding to all three α-Syn oligomer preparations is significantly less compared to Syn fibrils. Data are represented as mean ± SD from three independent experiments. Statistical significance was calculated using one-way ANOVA with Tukey’s multiple comparisons test. $$$p < 0.001, ***p < 0.001, ****p < 0.0001. Scale bar 100 nm

