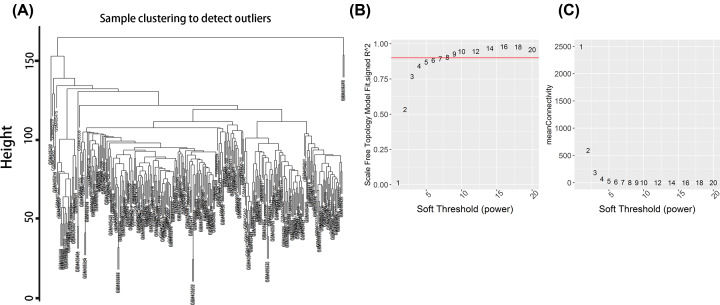
Figure 2. Sample clustering of WGNCA and scale-free topology model fit.
(A) Hierarchical sample clustering. Outlier samples are eliminated according to sample dendrogram. (B) Horizontal axis indicates power parameter; vertical axis indicates scale-free fit goodness. Red line indicates threshold 0.9 of fit goodness. Soft threshold with fit goodness being more than 0.9 is required to be selected. (C) Mean connectivity of network. Soft threshold with larger connectivity is required to be selected, helping explain the selection of 0.9 as the value of soft threshold.

