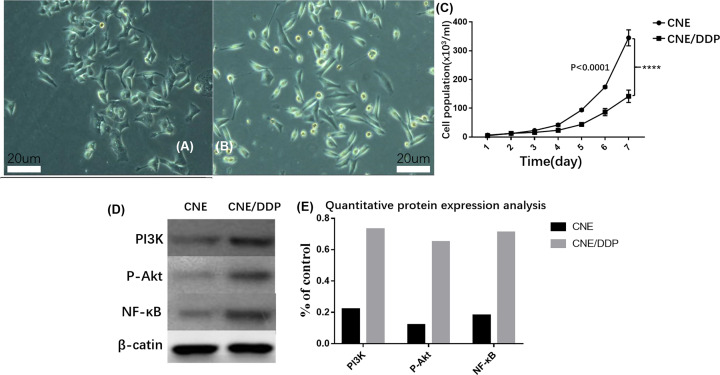
Figure 1. Cellular condition and activation of PI3K / Akt / NF-κB pathway.
(A) The morphology of CNE by inverted microscope. (B) The morphology of CNE by inverted microscope. (C) The growth curve of CNE and CNE/DDP; it was shown that the CNE cell lines grew faster than CNE/DDP, P<0.05. (D) The expressions of PI3K, p-Akt and NF-κB p65 in two cell lines; it was shown that the expressions of PI3K, p-Akt and NF-κB p65 in CNE/DDP was higher than those in CNE. (E) Quantitative analysis of protein results. Data are presented as the mean±s.e.m. P values were calculated by Student’s t test (****P<0.0001, ***P<0.001, **P<0.01 or *P<0.05).

