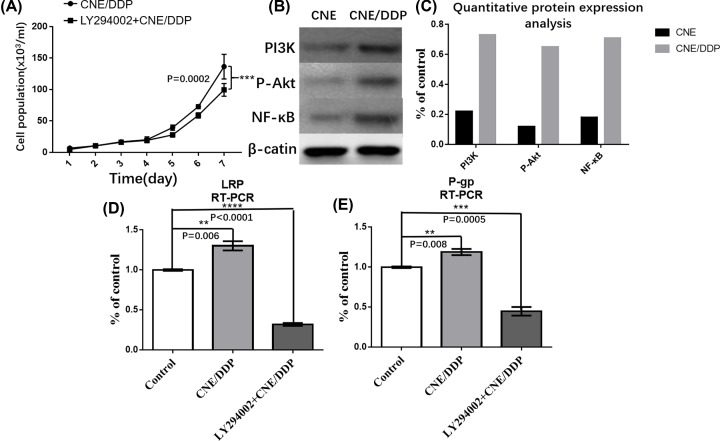
Figure 3. The role of PI3K/Akt signal pathways in MDR.
(A) The growth curve of LY294002 group and CNE/DDP group. It was shown that the CN/DDP cell lines grew a little faster than the LY294002 group, but without statistical difference (P>0.05). (B) It was shown the expressions of P-gp, LRP, PI3K,p-Akt and β-actin in LY294002 group and CNE/DDP group by Western blot. The gray degrees of P-gp, LRP and p-AKT in CNE/DDP were deeper than those in Ly294002 group (P<0.05), while PI3K and β-actin were no statistical difference (P>0.05). (C) The mRNAs of MRP-1 (G-gp) in LY294002 and CNE/DDP group. The red curve represented the expression of MRP-1 in CNE/DDP and green curve represented that in LY294002. It was shown that the mRNAs of MRP-1 in LY294002 group was decreased than that in CNE/DDP. (D) The mRNA expression of LRP in LY294002 and CNE/DDP group. (E) The mRNA expression of P-gp in LY294002 and CNE/DDP group. Data are presented as the mean±s.e.m. P values were calculated by Student’s t test (****P<0.0001, ***P<0.001, **P<0.01 or *P<0.05).

