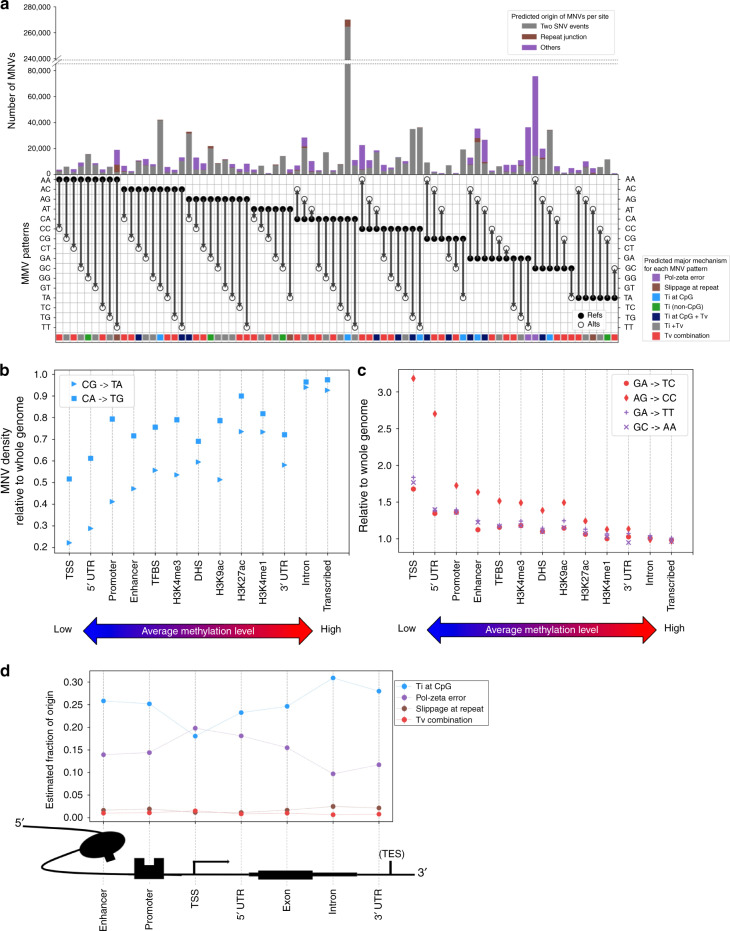
Fig. 4.
Distribution of MNVs across genome. a The number and the fraction of MNVs per origin, per substitution pattern. Gray are the estimated fraction of MNV originating from two single-nucleotide substitution events, brown for polymerase slippage at repeat contexts and purple are the others (presumably mainly replication error by pol-zeta). The colors along the bottom represent the estimated biological origins that dominate MNVs of that specific substitution pattern. b, c MNV density, defined as the number of MNVs per functional annotation divided by the base pair length in the annotation (relative to the whole-genome region), ordered by the methylation level of the functional category. d Estimated fraction of MNVs by different origins, per functional category around the coding region

