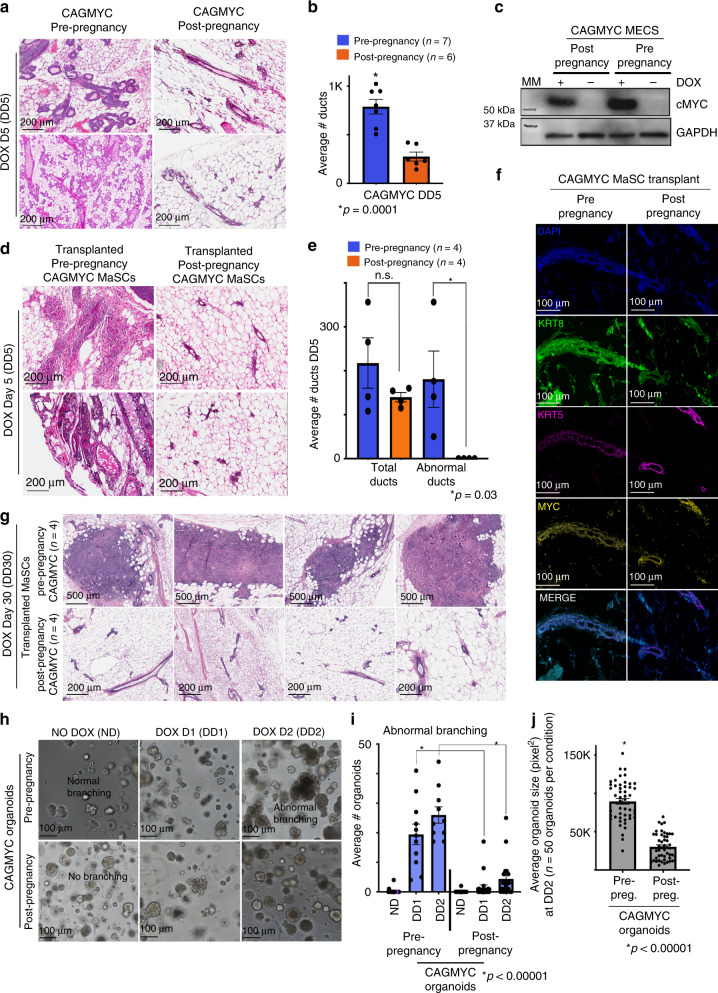
Fig. 3. The effects of cMYC overexpression on post-pregnancy MECs.
a, b H&E-stained images and duct quantification from mammary glands harvested from nulliparous (right panel) and parous (left panel) CAGMYC female mice treated with DOX for 5 days (DD5). Scale: 200 µm. n = 7 pre-pregnancy mammary glands (left bar) and n = 6 post-pregnancy mammary glands (right bar). Bars indicate mean number of ducts. *p = 0.0001. c Western blot of cMYC protein (62 kDa) in pre-pregnancy and post-pregnancy CAGMYC total MECs, with and without DOX treatment (5 days). GAPDH (146 kDa) used as endogenous control. MM = molecular marker. d, e H&E-stained mammary glands images and duct quantification from nulliparous CAG-only control mice, transplanted with pre-pregnancy and/or post-pregnancy CAGMYC CD1d+ MaSCs and treated with DOX for 5 days. Scale: 200 µm. n = 4 mammary glands injected with pre-pregnancy CD1d+ MaSCs, and n = 4 mammary glands injected with post-pregnancy CD1d+ MaSCs. Bars indicate mean number of total ducts (left) and abnormal ducts (right). n.s. not significant. *p = 0.003. f Immunofluorescence images of mammary glands from nulliparous CAG-only control mice, transplanted with pre-pregnancy and post-pregnancy CAGMYC MaSCs and treated with DOX for 5 days, visualizing DAPI (blue), KRT8 (green), KRT5 (magenta), and cMYC (yellow). Scale: 100 µm. g H&E-stained mammary glands images from nulliparous CAG-only control mice, transplanted with pre-pregnancy and/or post-pregnancy CAGMYC CD1d+ MaSCs and treated with DOX for 30 days. Scale: 500 µm. n = 4 mammary glands injected with pre-pregnancy CD1d+ MaSCs, and n = 4 mammary glands injected with post-pregnancy CD1d+ MaSCs. h–j Representative images, branching quantification, and size quantification of mammary organoid culture of pre- and post-pregnancy CAGMYC MECs, grown with essential media, with or without DOX (0.5 μg/mL). Scale: 200 µm. n = 2 independent biological replicates and three technical replicates per experiment. i *p < 0.00001. j n = 100 organoids, *p < 0.00001. For all analysis, error bars indicate standard error of mean across samples of same experimental group. p values were defined using Student t test.

