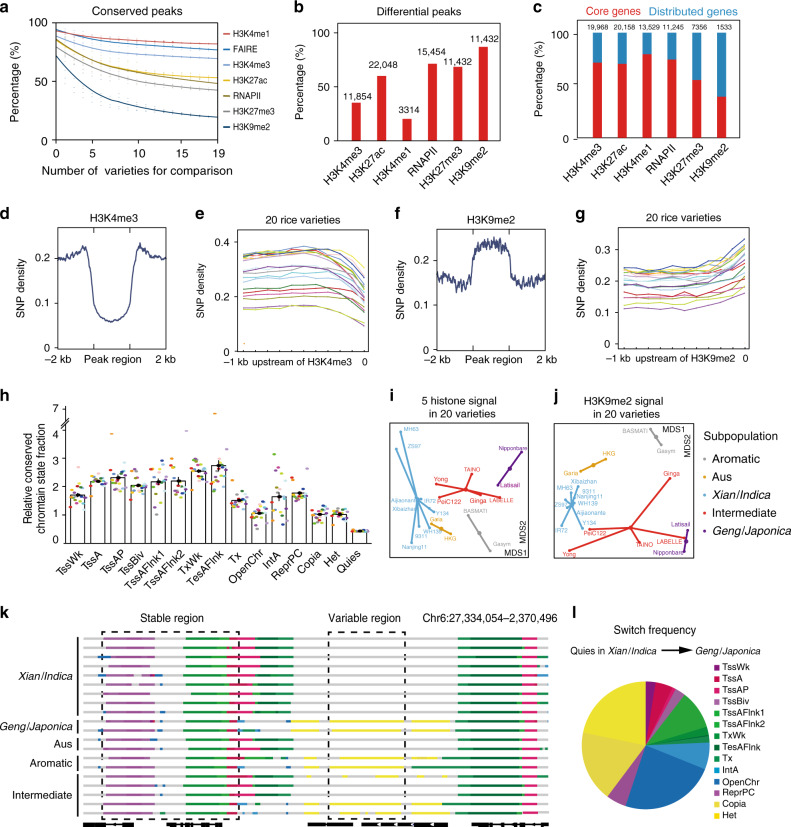
Fig. 6. Correlations of genetic variations and epigenome properties in 20 rice varieties.
a Fraction of regions for each mark signal with significant differences based on pairwise comparison. Differential regions were identified using DESeq2 (using a q value cutoff of 10−2 and a fold-change between individuals >1.5). b Number and percentage of histone marks that were differential in 20 rice varieties. c Distribution of core and distributed genes marked by different histone modifications in MH63. Core genes, present in more than 99% of 453 rice accessions; distributed genes, present in less than 99% of 453 rice accessions. The numbers in (b) and (c) indicate the sample sizes used in the analysis. d, f SNP (blue) density in H3K4me3 (d) and H3K9me2 (f) peak regions. e, g SNP enrichments upstream of H3K4me3-modified (e) and H3K9me2-modified (g) regions indicated by dotted boxes in 20 rice varieties. h The relative proportion of conserved chromatin state in the whole genome. i, j Nonmetric Multidimensional scaling (NMDS) plot of 20 rice varieties indicates their relationships based on similarity of five histone modification signal (i) and H3K9me2 signal (j). First two dimensions are shown as MDS1 versus MDS2. The five different subpopulations52 Xian/Indica, Aus, Geng/Japonica, aromatic and an intermediate group, are shown in different colors. k An example of a nonvariable and a variable region for chromatin state in 20 varieties. All epigenome datasets were mapped to the Nipponbare reference sequence MSU7.053. State colors are as in (g). l The pie chart of the relative frequency of CS from Xian/Indica to Geng/Japonica. Source Data underlying Fig. 6a, h–j, l are provided as a Source Data file.

