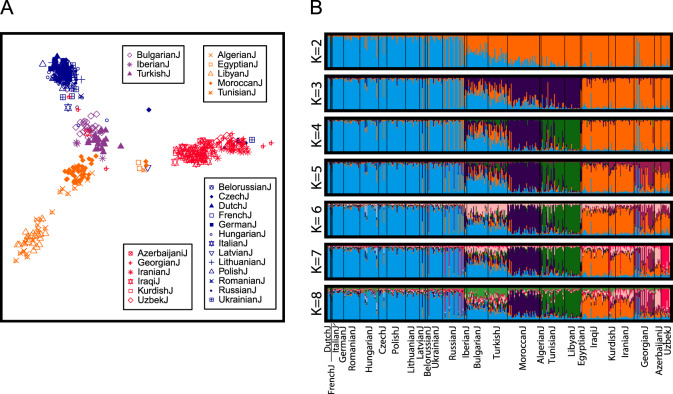
Fig. 3. Population structure for Jewish populations.
a Multidimensional scaling. Color codes follow Fig. 1c. b Unsupervised clustering using Structure. Among 20 replicates, the major mode shown appears in 20, 20, 18, 15, 9, 14, and 10 runs for K = 2, 3, 4, 5, 6, 7, and 8, respectively. Both plots include 420 individuals from 27 populations and exclude Ethiopian, Indian, and Yemenite Jewish populations.

