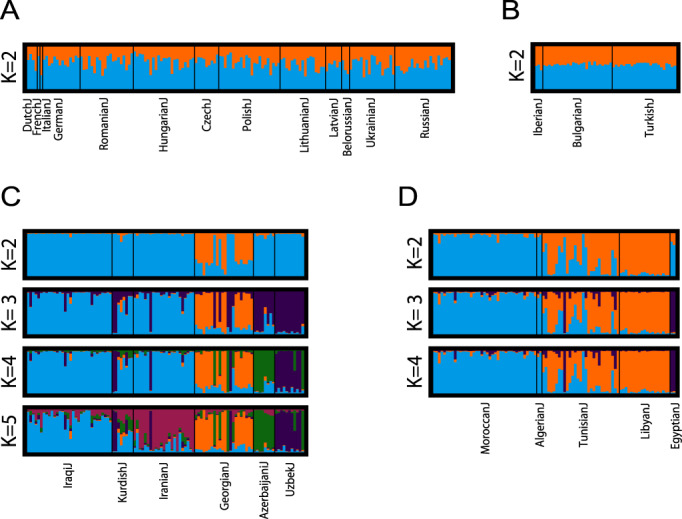
Fig. 5. Unsupervised clustering of subgroups of Jewish populations, using Structure.

a Ashkenazi. Among 20 replicates, the major mode shown appears in 13 replicates for K = 2. b Sephardi. The major mode appears in 20 replicates for K = 2. c Mizrahi. The major mode appears in 14, 9, 11, and 16 replicates for K = 2, 3, 4, and 5, respectively. d North African. The major mode appears in 20, 15, and 18 replicates for K = 2, 3, and 4, respectively. The analysis uses the individual sets from Figs. 4e, h, f, and g. In each panel, the largest value of K displayed was selected so that no additional structure was observed for larger K values.
