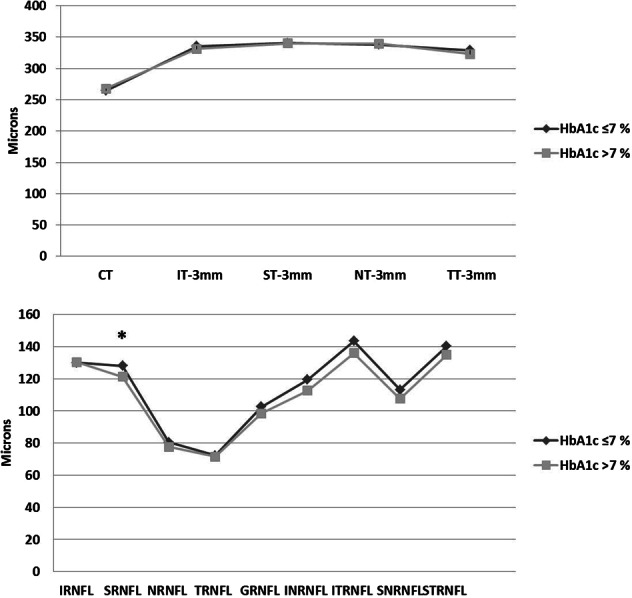
Fig. 1.

The graph (top) shows similar central foveal thickness (CT), inferior (IT), superior (ST), nasal (NT) and temporal (TT) macular thickness (microns) values (within the 3 mm macular ETDRS circle) between the diabetic patients with HbA1c level ≤ 7% vs. HbA1c > 7% (p = 0.482, p = 0.501, p = 0.905, p = 0.746 and p = 0.307, respectively, independent samples t-test). The peripapillary superior retinal nerve fibre layer (SRNFL) was significantly thinner (p = 0.049) in patients with HbA1c > 7% when compared with the patients with HbA1c level ≤ 7%. However, inferior (IRNFL), nasal (NRNFL), temporal (TRNFL), global (GRNFL), inferior-nasal (INRNFL), inferior-temporal (ITRNFL), superior-nasal (SNRNFL) and superior-temporal (STRNFL) peripapillary RNFL thicknesses did not differ between the two groups (bottom graph) (p = 0.982, p = 0.371, p = 0.847, p = 0.063, p = 0.193, p = 0.233, p = 0.191 and p = 0.191, respectively). An asterisk indicates statistically significant difference between the two groups (p < 0.05), independent samples t-test
