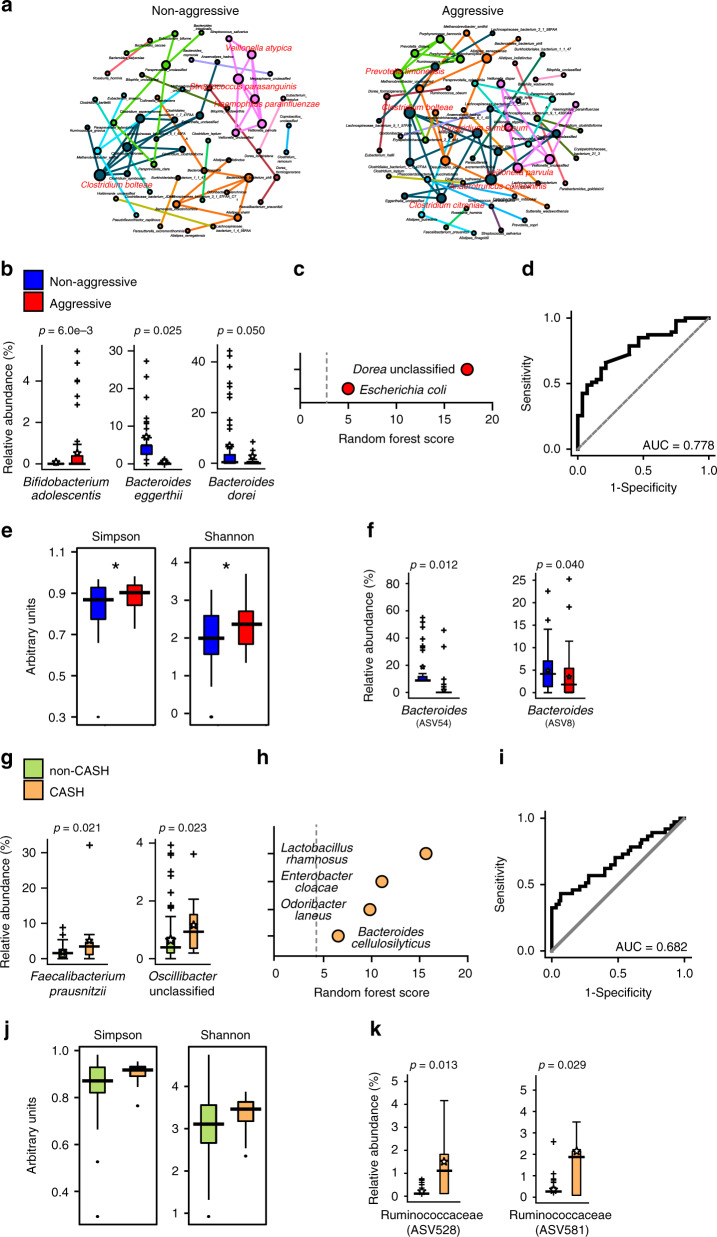
Fig. 3. CA patient subpopulations can have different microbiota.
a Organization of microbiome species in non-aggressive and aggressive patients. Co-occurrence network analyses were performed at species level, as determined by metagenomic shotgun data analysis (n = 45 non-aggressive patients, n = 62 aggressive patients, keystone species are labeled in red). b Multi-variate differential abundance analysis of metagenomic shotgun data between non-aggressive and aggressive patients at species level. Species with significantly different abundance are presented as box-whisker plots (ANCOM analysis followed by two-sided Mann–Whitney U test with Benjamini–Hochberg FDR correction, blue boxes: non-aggressive patients, red boxes: aggressive patients). c Identification of key species by random forest analysis. d ROC curve was identified based on best-weighted combination of all bacterial species identified by multi-variate and random forest analyses (AUC = 0.778, specificity = 0.786, sensitivity = 0.660). e α-Diversity analyses of fecal samples of CA patients with non-aggressive and aggressive disease by Shannon and Simpson indices based on 16S rRNA gene amplicon sequencing data (n = 43 non-aggressive patients, n = 58 aggressive patients, Kruskal–Wallis one-way analysis of variance test, blue boxes: non-aggressive patients, red boxes: aggressive patients). f Multi-variate differential abundance taxonomic analyses between non-aggressive and aggressive CA patients based on 16S rRNA gene amplicon sequencing results. ESVs with significantly different relative abundances are presented as box-whisker plots (ANCOM analysis followed by two-sided Mann–Whitney U test with Benjamini–Hochberg FDR correction, blue boxes: non-aggressive patients, red boxes: aggressive patients). g Multi-variate differential abundance analysis of metagenomic shotgun data between non-CASH and CASH patients at the species level. Species with significantly different abundance are presented as box-whisker plots (n = 100 non-CASH patients, n = 13 CASH patients, ANCOM analysis followed by two-sided Mann–Whitney U test with Benjamini–Hochberg FDR correction, green boxes: non-CASH patients, orange boxes: CASH patients). h Identification of key species by random forest analysis. i ROC curve was identified based on best-weighted combination of all bacterial species identified by multi-variate and random forest analyses (AUC = 0.682, specificity = 0.933, sensitivity = 0.432). j α-Diversity analyses of fecal samples of CA patients with non-CASH and CASH disease by Shannon and Simpson indices based on 16S rRNA gene amplicon sequencing data, presented as box-whisker plots (n = 93 non-CASH patients, n = 13 CASH patients, Kruskal–Wallis one-way analysis of variance test, green boxes: non-CASH patients, orange boxes: CASH patients). k Multi-variate differential abundance taxonomic analyses between non-CASH and CASH patients based on 16S rRNA gene amplicon sequencing results. ESVs with significantly different relative abundances are presented as box-whisker plots (ANCOM analysis followed by two-sided Mann–Whitney U test with Benjamini–Hochberg FDR correction, green boxes: non-CASH patients, orange boxes: CASH patients). In box plots, bounds of boxes show IQR, top and bottom whiskers demonstrate maximum and minimum, lines in the middle of the box indicate median, and stars show mean of the data. + signs indicate outliers.

