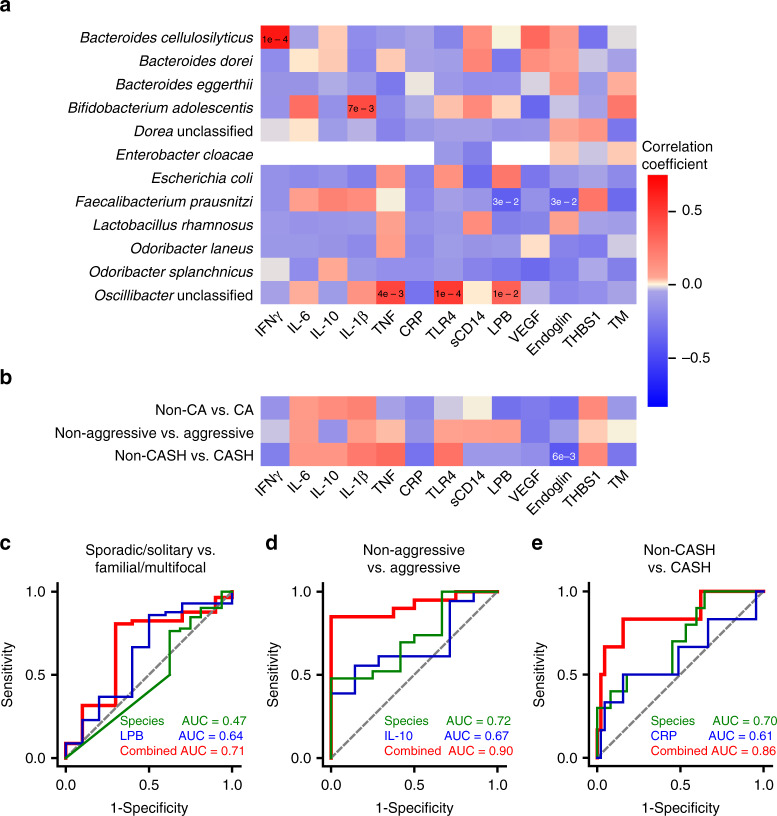
Fig. 4. Plasma and fecal microbiome as CA biomarkers.
a Correlation between individual bacterial species and circulating factors. Correlation between species identified by multi-variate differential abundance and random forest analyses (Figs. 1 and 3, Supplementary Fig. 2) and individual plasma biomarkers. Degree of correlation is color coded (also see Supplementary Table 1, Pearson’s correlation testing; red: positive correlation; blue: negative correlation). b Correlation between combination of species identified based on clinical questions and circulating factors. Correlation between combination of bacterial species identified (in Figs. 1 and 3, Supplementary Fig. 2) and individual plasma biomarkers. Degree of correlation is color coded (also see Supplementary Table 1, Pearson’s correlation testing, red: positive correlation, blue: negative correlation). c–e Comparison of best ROC curve determined by combination of bacterial species identified in Fig. 3 and Supplementary Fig. 2, individual circulating factors, and bacterial species and individual circulating factors. c Distinction between sporadic/solitary and familial/multifocal CA patients (green: bacterial species identified in Supplementary Fig. 2 (B. dorei), blue: LPB, red: combined bacterial species and LPB). d Distinction between non-aggressive and aggressive CA patients (green: bacterial species identified in Fig. 3b, c, blue: IL-10, red: combined bacterial species and IL-10). e Distinction between non-CASH and CASH patients (CASH patient, green: bacterial species identified in Fig. 3g, h, blue: CRP, red: combined bacterial species and CRP). IFNγ interferon-γ, TNF tumor necrosis factor; CRP C-reactive protein, TLR4 toll-like receptor 4, VEGF vascular endothelial growth factor, THBS1 thrombospondin 1, TM thrombomodulin.

