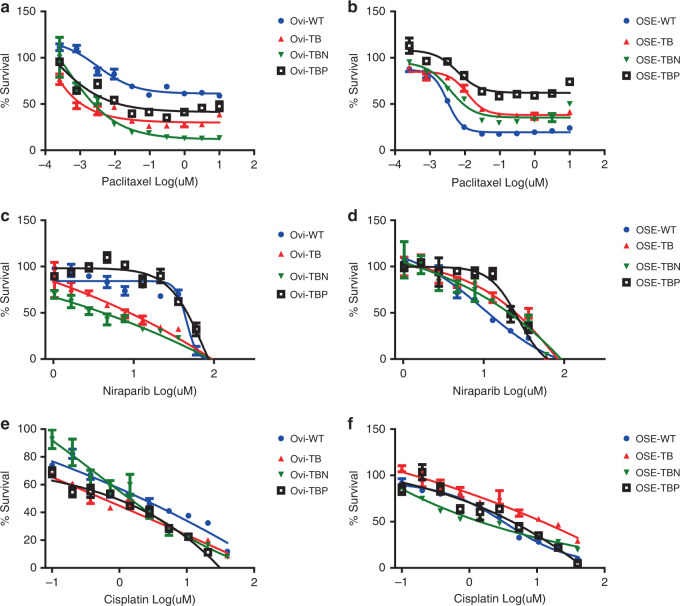
Fig. 4. In vitro drug sensitivity of oviductal and OSE lines.
a, b Representative dose–response curves of paclitaxel-treated a oviductal and b OSE clones. c, d Representative dose–response curves of niraparib-treated c oviductal and d OSE clones. e, f Representative dose–response curves of cisplatin treated e oviductal and f OSE clones. a–f Error bars represent ±SEM of quadruplicates (n = 4) over two independent experiments. Ovi—oviduct; OSE—ovarian surface epithelium; WT—wild type; TB—Trp53, Brca1 mutant; TBN—Trp53, Brca1, Nf1 mutant; TBP—Trp53, Brca1, Pten mutant.

