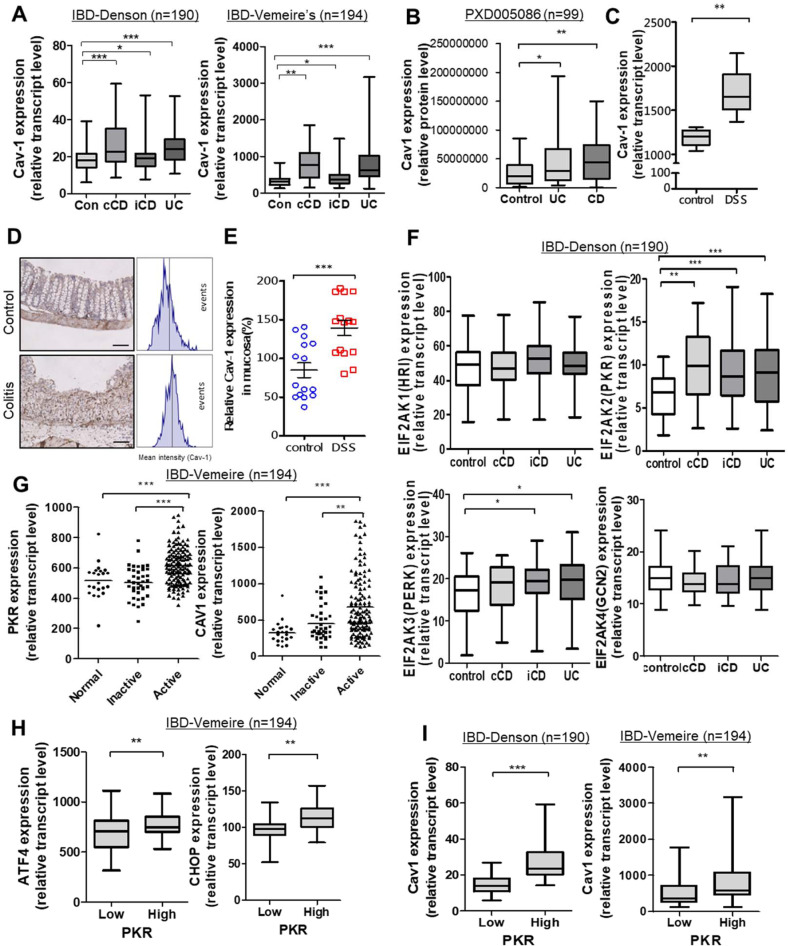
Fig. 1. Involvement of ISR and Cav-1 in IBD.
a Intestinal Cav-1 expression was compared in patients with different IBD types in datasets gse117993 (Denson's, n = 190) and gse75214 (Vemeire's, n = 194). b Colonic Cav-1 protein expression was compared in patients with different IBD types in a proteomic dataset (PXD005086, n = 99). c Intestinal Cav-1 expression was compared in DSS-exposed mice using the dataset (gse22307, n = 6-7). a–c Results are shown as box-and-whisker plots (min to max) and asterisks (*) indicate significant differences from the control group (*p < 0.05, **p < 0.01, ***p < 0.001 using two-tailed unpaired Student’s t test). d, e Cav-1 expression was assessed in colons from 8-week-old female C57BL/6 mice treated with vehicle or 3% (w/v) DSS (n = 14–15, each group). Microscopic analysis was conducted at 200× magnification; scale bar(s): 100 μm. d Relative Cav-1 density was measured using the HistoQuest tissue analysis software (each histogram represents events with increasing DAB levels, as denoted in the method in detail). e Quantitative comparisons are shown in the graph. Asterisks (***) indicate a significant difference from the control group (p < 0.001 using two-tailed unpaired Student’s t test). f, g Intestinal expression of eIF2a kinases (EIF2AK1, EIF2AK2, EIF2AK3, or EIF2AK4) or Cav-1 was compared in patients with different IBD types from datasets gse117993 (e, Denson’s, n = 190) and gse75214 (f, Vemeire’s, n = 194). UC, ulcerative colitis; cCD, colon-only CD; iCD, ileo-colonic CD. Results are shown as box-and-whisker plots (min to max). Asterisks (*) indicate significant differences between groups (*p < 0.05, **p < 0.01, ***p < 0.001 using two-tailed unpaired Student’s t test). h, i Expression levels of PKR target genes were assessed in patients with IBD (gse75214 [n = 194] or gse117993 [n = 190]). Based on PKR levels, we chose the 50 highest and 50 lowest samples, which were further compared for expression of ISR-linked genes (ATF4 and CHOP) (h), or Cav-1 (i). Results are shown as box-and-whisker plots (min to max). Asterisks (*) indicate significant differences from the low-expression group (**p < 0.01, ***p < 0.001 using two-tailed unpaired Student’s t test).

