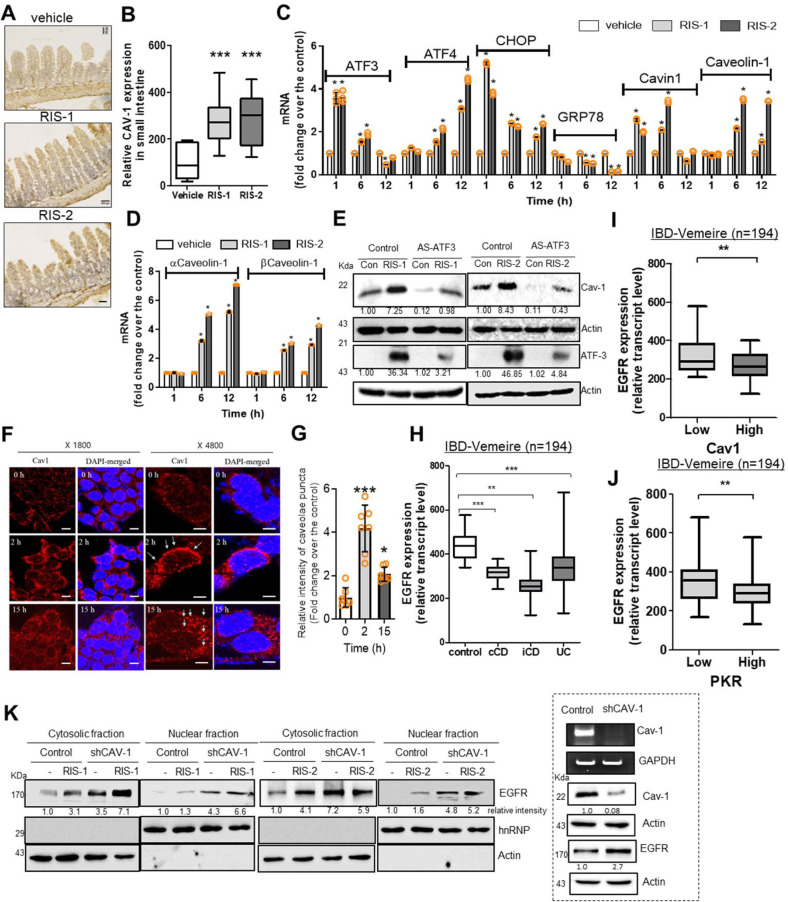
Fig. 2. Cav-1 suppresses EGFR expression in enterocytes.
a, b Cav-1 expression was assessed in the ilea of 8-week-old male C57BL/6 mice treated with vehicle, 25 mg/kg RIS-1, or 25 mg/kg RIS-2 for 24 h (n = 12–19, each group). a Microscopic analysis was performed at 200× magnification; scale bar(s): 100 μm. b Quantitative comparisons are shown as box-and-whisker plots (min to max). c, d HCT-8 cells were treated with vehicle, 50 ng/mL RIS-1, or 500 ng/mL RIS-2 for the indicated time. The mRNA was measured using real-time RT-PCR. Results are shown as mean values ± SD (n = 3). (e) HCT-8 cells stably transfected with control or antisense ATF3 (AS-ATF3) expression vector were treated with vehicle, 50 ng/mL RIS-1, or 500 ng/mL RIS-2 for 15 h (Cav-1) or 3 h (ATF3). Cell lysates were subjected to western blot analysis. f, g HCT-8 cells were treated with vehicle or 500 ng/mL DON (RIS-2) for the indicated time. f Cav-1 and nuclear regions were visualized using anti-Cav-1 and DAPI, respectively. Microscopic analysis was performed at 1800× or 4800× magnification; scale bar(s): 20 or 10 μm, respectively. g Quantitative comparisons are shown in the graph. Results are shown as mean values ± SD (n = 7). h Intestinal EGFR expression was compared in patients with different IBD types (Vemeire’s, gse75214, n = 194). Results are shown as box-and-whisker plots (min to max). i,j EGFR expression was assessed in patients with IBD based on the gene expression array of IBD patients (gse75214 [n = 194]). Based on Cav-1 (i) or PKR levels (j), we chose the 50 highest and 50 lowest samples, which were further compared for EGFR expression. Results are shown as box-and-whisker plots (min to max). a–j Asterisks (*) indicate significant differences between groups (*p < 0.05, **p < 0.01, and ***p < 0.001 using two-tailed unpaired Student’s t test). k HCT-8 cells transfected with control or shCav-1 vector were treated with vehicle, 50 ng/mL RIS-1, or 500 ng/mL RIS-2 for 1 h. Cytosolic or nuclear fractions were subjected to western blot analysis.

