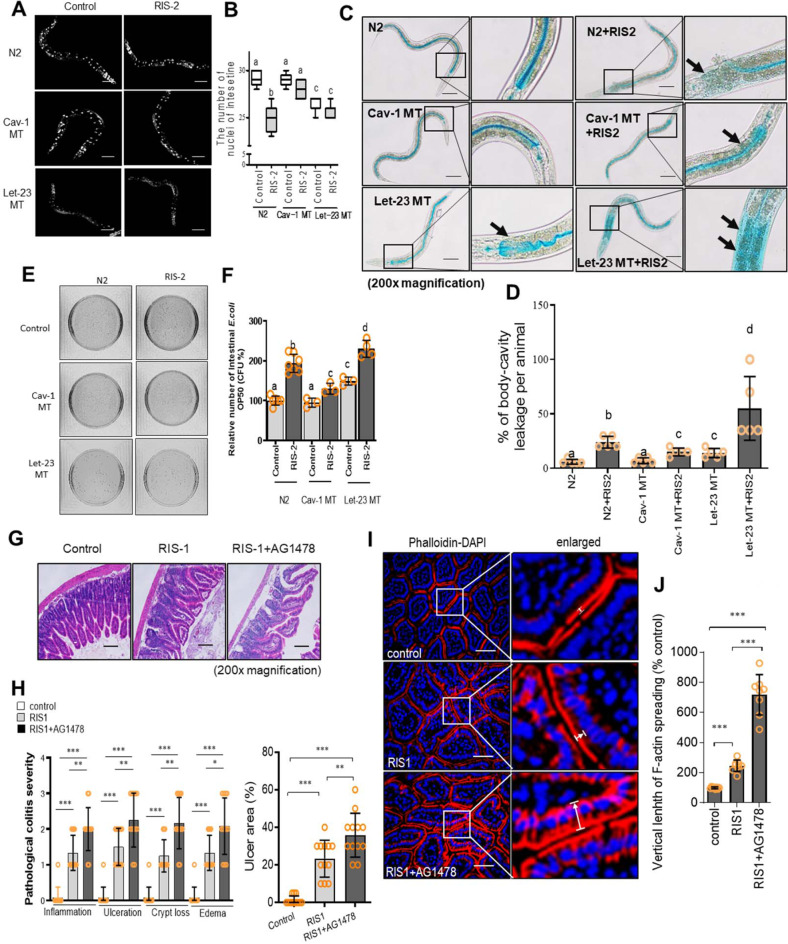
Fig. 3. Effects of Cav-1 and EGFR on the gut barrier in the ribosome-inactivated gut.
a, b Worms (wild-type [N2], caveolin-1 mutant [Cav-1 MT], and EGFR mutant [let-23 MT] nematodes, n = 6-9 animals per group) were treated with 500 ng/mL RIS-2 for 24 h, and then stained with DAPI (blue). a Fluorescence microscopic analysis was performed at 200× magnification; scale bar(s): 100 μm. b The graph indicates the number of intestinal nuclei per worm; results are shown as box-and-whisker plots (min to max). c, d Representative images of N2, Cat-1 MT, and let-23 MT nematodes after 3 h of staining with blue food dye and 24 h of RIS-2 treatment. c Black arrows indicate areas in which blue food dye has leaked from the gut lumen into the body cavity, causing the Smurf phenotype (200× magnification; scale bar(s): 100 μm). d The graph shows the percentage of body-cavity leakage per animal (n = 6 animals per group). Data represent the means ± SD (n = 5). e, f Detection (e) and quantitation (f) of viable intestinal Escherichia coli OP50 in N2, Cav-1 MT, and let-23 MT nematodes exposed to 500 ng/mL DON for 24 h. Data represent the means ± SD (n = 3–8). a–f Different letters over each bar or box represent significant differences between groups (p < 0.05 using one-way ANOVA with the Newman–Keuls post hoc test). g–j Eight-week-old male C57BL/6 mice received AG1478 (1 mg/mouse) intraperitoneally twice during 2 days before treatment with 25 mg/kg RIS-1 (n = 6–12 animals per group). Animals were sacrificed after RIS-1 treatment for 12 h. g Histological observation of hematoxylin and eosin (H&E)-stained small intestine sections. h pathological severity (200 × ; scale bar(s): 100 μm). i F-actin staining (red) and DAPI nuclear staining (blue). White arrows indicate F-actin localization altered from the apical distribution. Microscopic analysis was performed at 400 × magnification; scale bar(s): 50 μm. j Relative quantification of F-actin spread from the apical parts to basolateral or basal areas (%). h, j Asterisks (*) indicate significant differences between groups (*p < 0.05, **p < 0.01, and ***p < 0.001 using two-tailed unpaired Student’s t test).

