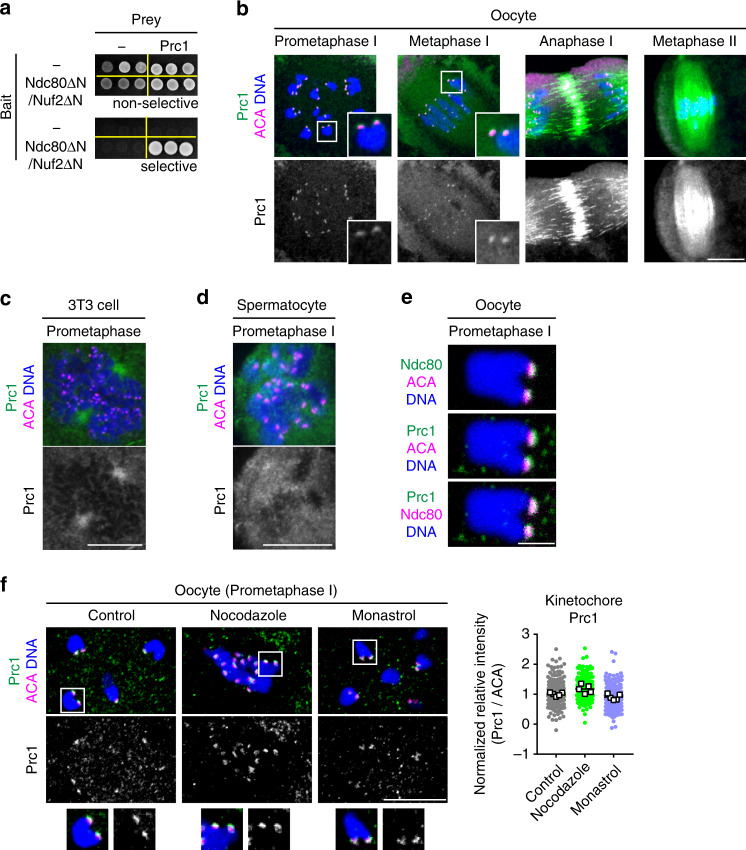
Fig. 2. Ndc80/Nuf2 interacts with the antiparallel microtubule crosslinker Prc1 at kinetochores.
a Prc1 can interact with Ndc80ΔN/Nuf2ΔN. Yeast two-hybrid assay using Ndc80ΔN fused with a DNA-binding domain, Nuf2ΔN, and Prc1 fused with a transcription activation domain. Selective (−His, −Ade) and nonselective (+His, +Ade) plates were used. b Prc1 localizes to kinetochores. Z-projection images of oocytes stained for Prc1 (green), kinetochores (ACA, magenta), and DNA (Hoechst33342, blue) are shown. Prc1 signals at kinetochores are magnified. One of the z-slice images at metaphase II is shown in Supplementary Fig. 6g. More than three independent experiments were performed. c Prc1 is not enriched at kinetochores at mitotic prometaphase in centrosomal cultured cells. NIH3T3 cells were stained for Prc1 (green), kinetochores (ACA, magenta), and DNA (Hoechst33342, blue). Three independent experiments were performed. d Prc1 is not enriched at kinetochores at meiotic prometaphase I in centrosomal spermatocytes. Spermatocytes were stained for Prc1 (green), kinetochores (ACA, magenta), and DNA (Hoechst33342, blue). Three independent experiments were performed. e Prc1 colocalizes with Ndc80. Oocytes expressing Ndc80-sfGFP at prometaphase I (2 h after NEBD) were immunostained with anti-GFP, anti-Prc1, and ACA antibodies. DNA is counterstained with Hoechst33342 (blue). Magnified images show that Prc1 is located closer to Ndc80 than to ACA. Three independent experiments were performed. f Prc1 localizes to kinetochores independently of microtubule attachment and spindle bipolarization. Oocytes were treated with nocodazole or monastrol at 1.5 h after NEBD, incubated for 30 min, and immunostained for Prc1 (green), kinetochores (ACA, magenta), and DNA (Hoechst33342, blue). Prc1 signals at kinetochores are magnified. The kinetochore ratios of the Prc1 signals to the ACA signal are shown. Spots and squares correspond to individual kinetochores and oocytes, respectively (n = 200, 200, 198 kinetochores from 5, 5, 5 oocytes). Three independent experiments were performed. Mean +/− SD are presented. Scale bars; 10 μm (b), (c), (d), and (f); 2 μm (e).

