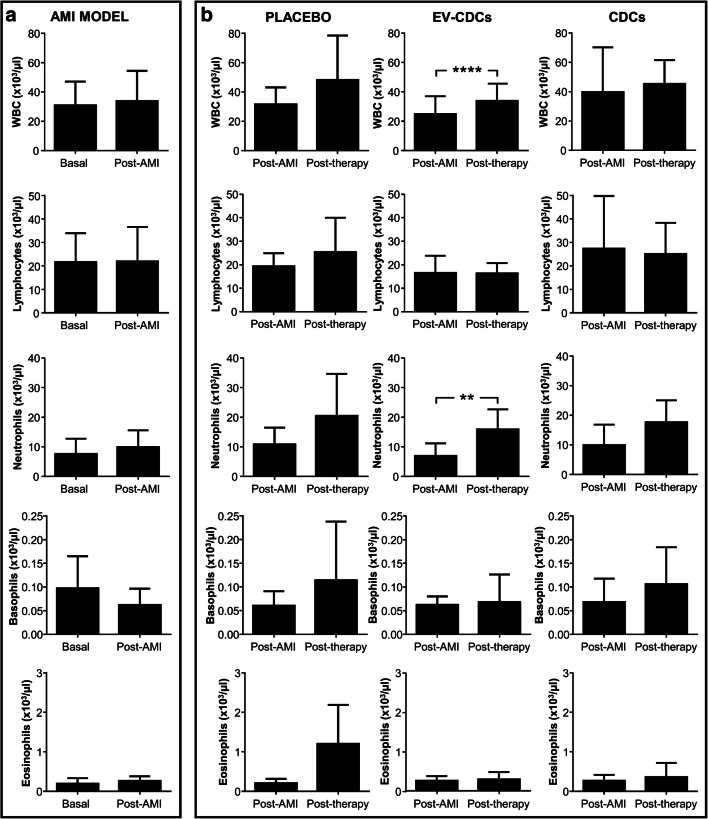
Fig. 2.
White blood cell analysis in peripheral blood. Blood samples were collected in EDTA containing tubes before acute myocardial infarction model creation (Basal), 72 h after (Post-AMI) and 24 h after the treatment (Post-therapy) and white blood cells were counted in an automated hematology analyzer. Normality was assessed using a Shapiro-Wilk test. Paired comparisons of the AMI model (a)(n = 15) and paired comparisons of the administered therapies (b) (n = 5) were performed using a Student t-test for parametric data or a Wilcoxon signed rank test with the Yates continuity correction for non-parametric variables. Graphs show the mean ± SD of cell populations. **p ≤ 0.01. ****p ≤ 0.0001

