Fig. 1.

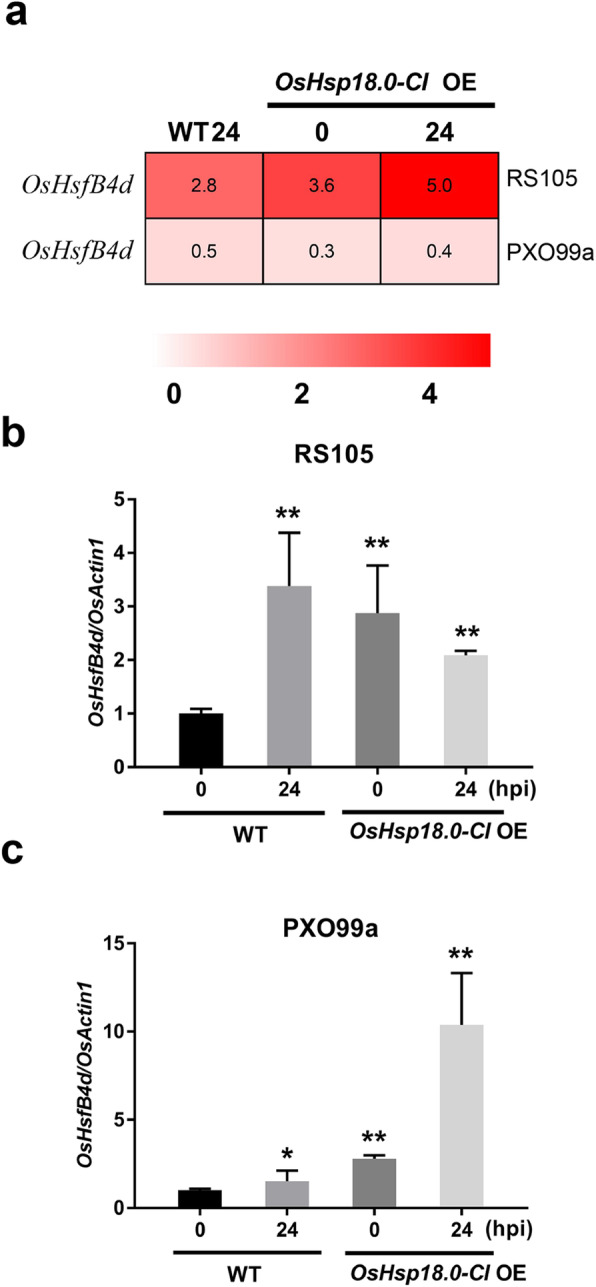
OsHsfB4d expression is induced by Xanthomonas oryzae pv. oryzicola (Xoc) and Xanthomonas oryzae pv. oryzae (Xoo) inoculation. a Hierarchical cluster analysis of OsHsfB4d using the OsHsp18.0-CI RNA-seq data. Quantification of the expression level of OsHsfB4d in response to RS105 (b) or PXO99a (c) by qRT-PCR. Fully expanded leaves of six-week-old ZH11 and OsHsp18.0-CI-OE plants were harvested at 0 and 24 h post inoculation. The bars represent the mean (three replicates for gene expression) ± SD. The significance of expression compared to that at 0 h in the WT at P values of less than 0.05 and 0.01 are indicated by “*” and “**”, respectively
