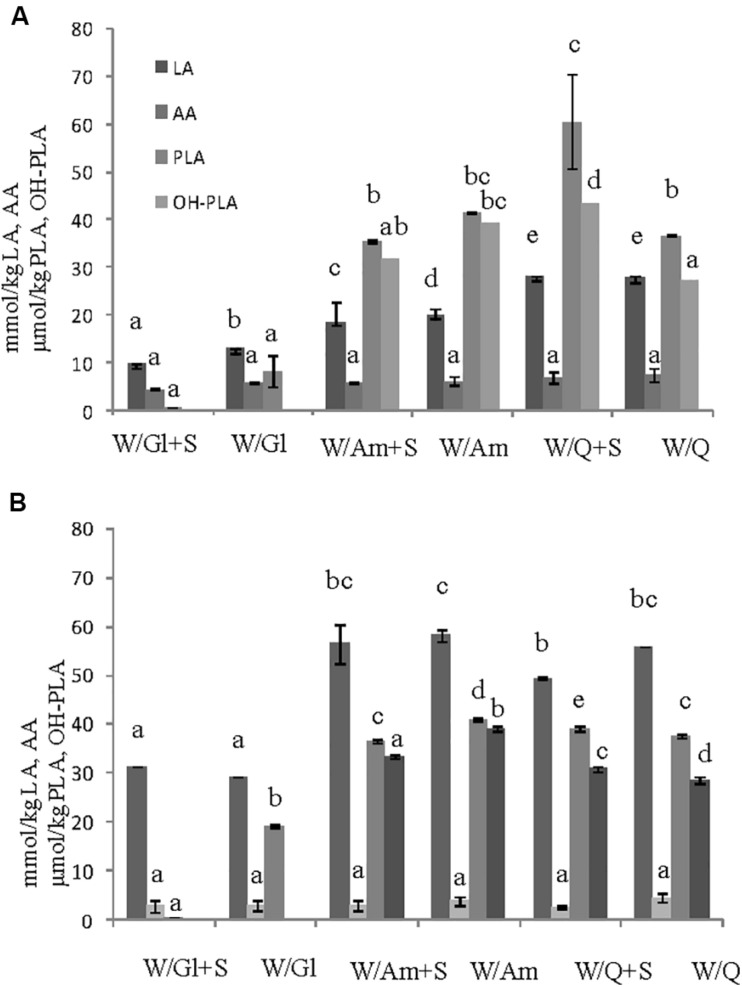
FIGURE 2.
Effect of different flours on the organic acid content (lactic, LA, acetic, AA, phenyllactic, PLA, OH-phenyllactic, OH-PLA) registered in the preliminary LSs obtained by the (A) W. cibaria C43-11 and the (B) L. plantarum ITM21B after 15 h fermentation. Ingredients: wheat flour (W) with gluten (Gl) or amaranth flour (Am) or quinoa flour (Q) (ratio 1:1), in the presence or not of sucrose (S) (3% w/w). The data are represented as mean ± standard error. Different letters above the columns indicate significant difference among the means of each organic acid by Tukey HSD’s test (p < 0.05).

