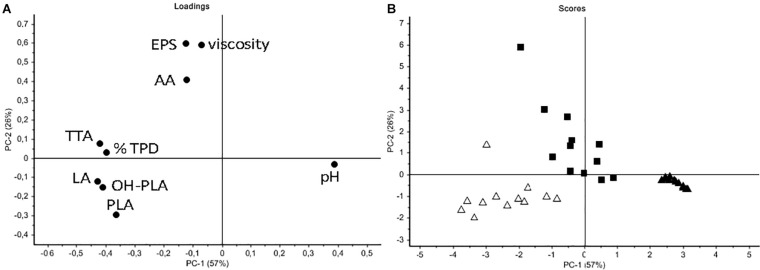
FIGURE 6.
Principal component analysis (PCA) of all data (from the optimized LSs formulated as in Table 2). (A) Loading plot indicating the correlation between variables (pH; TTA; % total protein degradation, TPD; organic acids – lactic, LA; acetic, AA; phenyllactic, PLA; hydroxy-phenyllactic OH-PLA), EPS content and viscosity. (B) Score plot indicating sample distribution basing on the inoculated strains (black square C43-11; open triangle ITM21B; black triangle Co).

