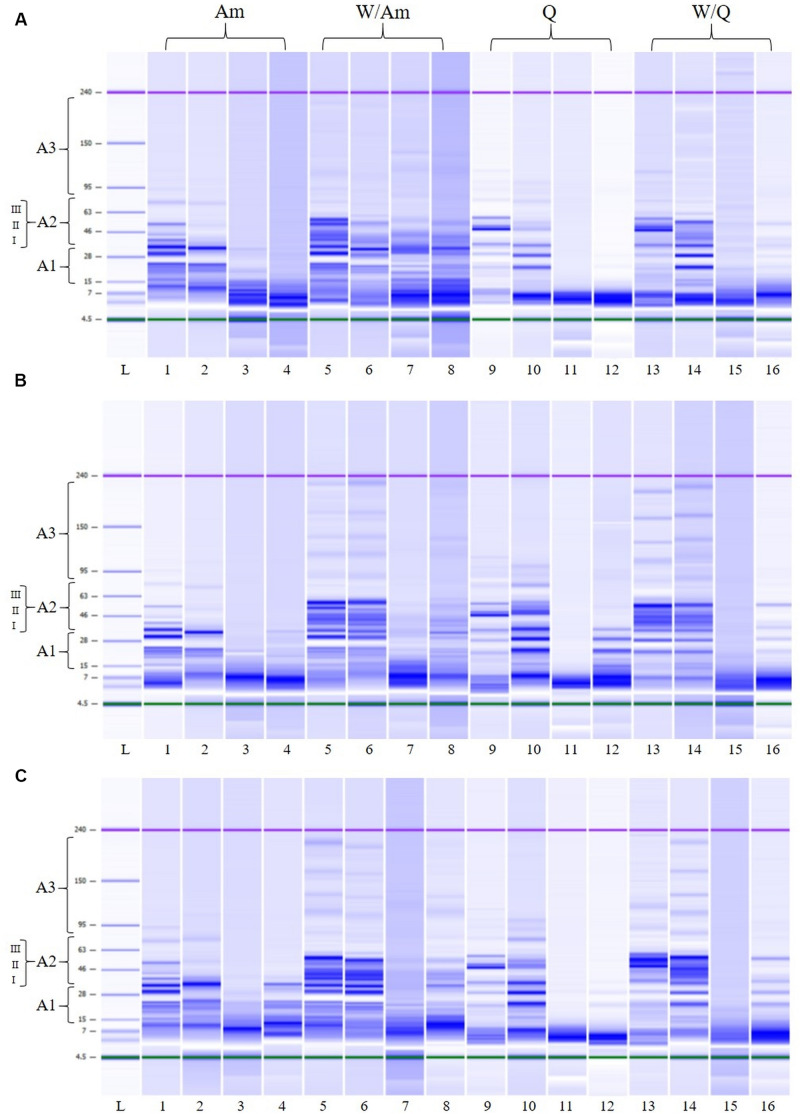
FIGURE 8.
Electrophoretic analysis (LoaC) of total proteins from amaranth (Am), wheat/amaranth (W/Am), quinoa (Q), and wheat/quinoa/ (W/Q) liquid sourdoughs (LSs) with DY500_3%S (A), DY250_3%S (B), and DY250_6%S (C) shown as gel-like images on Protein230 LabChip; Molecular weight marker (L); LS uninoculated control T0 (lanes 1, 5, 9, 13); LS uninoculated control T15 (lanes 2, 6, 10, 14); L. plantarum ITM21B (lanes 3, 7, 11, 15); W. confusa C43-11 (lanes 4, 8, 12, 16). Numbered brackets indicate molecular weight areas: A1 (14–30 kDa), A2 (I, 31–42 kDa; II, 43–55 kDa; III, 56–79 kDa), A3 (>70 kDa).

