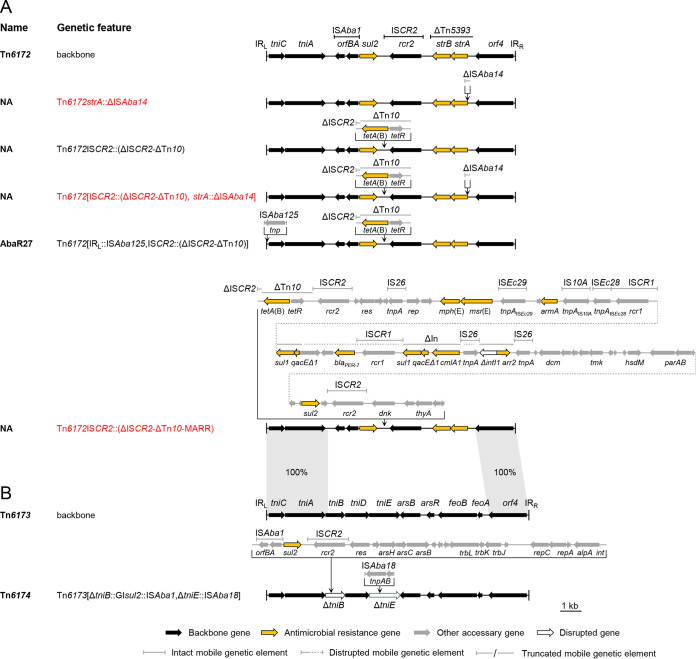
FIG 3.
Comparison of Tn6172- or Tn6173-derived genetic configurations. (A) Tn6172-derived variants. (B) Tn6173-derived variant. The backbones are shown at the top of the panels. The backbone segments in the variants are placed in aligned positions. The names of the reported elements bearing the corresponding genetic configurations are given. NA, not available. Novel genetic configurations are shown in red. Dotted lines are used to connect sequences. Syntenic regions between Tn6172 and Tn6173 are connected by gray. The schematic representations are drawn to scale.

