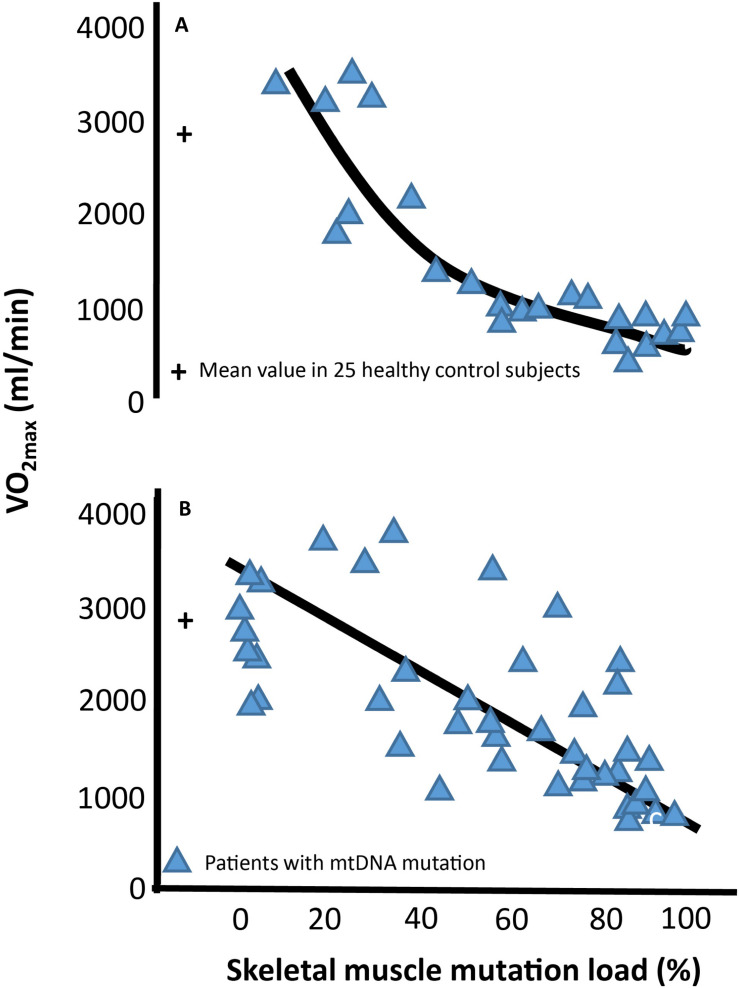
FIGURE 2.
Association between maximal oxidative capacity and skeletal muscle mitochondrial DNA mutation load Correlation between level of percentage mitochondrial DNA (mtDNA) mutation load in skeletal muscle and maximal oxygen uptake (VO2max) in 24 subjects with different mtDNA mutation (A) and 51 subjects with the 3,243 A > G point mutation of mtDNA (B). Blue triangles each represent a subjects with mtDNA mutation. The cross at 0% muscle mutation represents the mean ±SE of 25 age- and gender matched healthy subjects.

