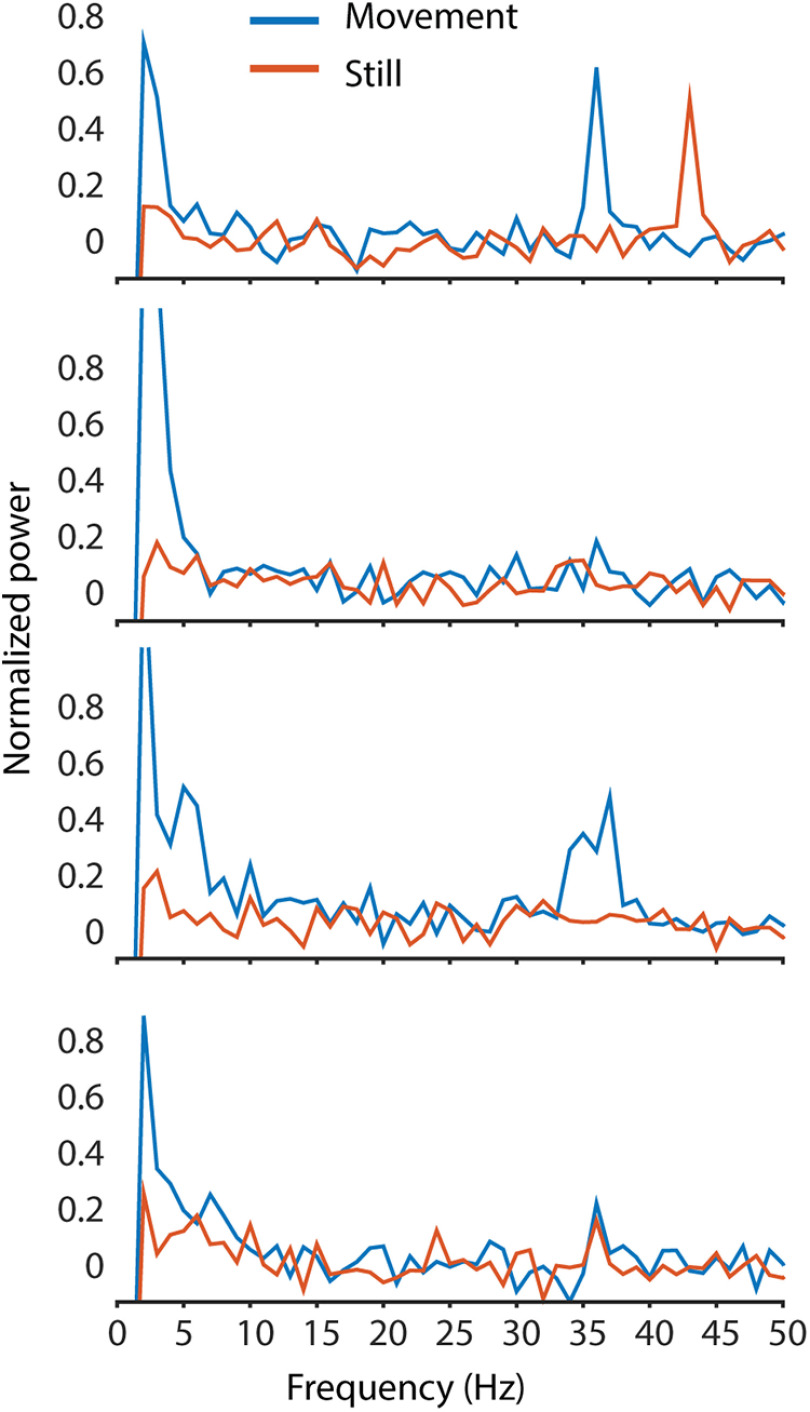
Figure 12.
Example spectra from awake recordings with 1 s movement segments separated from 1 s still segments (based on rotation of the treadmill during the 1 s epoch). Movement alters oscillations; however, peaks can be found in both movement and still periods. The small segment size used reduces the frequency resolution of these spectra to 1 Hz, and the low-frequency cutoff to 1 Hz. The number of epochs averaged for each movement trace in each respective graph (top to bottom) are 69, 205, 194, and 161, 1 s each; the number of still epochs averaged are 261, 125, 136, and 169, 1 s each.

