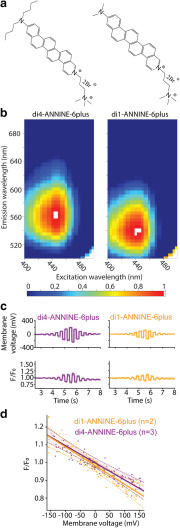
Figure 4.
Structure, fluorescence spectrum, and sensitivity of di1-ANNINE-6plus. a, Structure of di4-ANNINE-6plus (previously published under the name ANNINE-6plus) and di1-ANNINE-6plus. b, 2D fluorescence spectra of both dyes measured in cortical tissue, normalized but otherwise not corrected. c, HEK293 cells in a single confluent layer were simultaneously current injected with a patch pipette and voltage imaged (488 nm excitation, 561 nm long-pass filter). Recordings were made with di1-ANNINE-6plus and di4-ANNINE-6plus (orange and purple traces, respectively). d, Fluorescence changes over membrane voltage change per voltage step (n indicates the number of cells). A linear regression was calculated for each dye (solid line), as well as the 95% confidence interval for each regression line (dotted lines), supporting that both dyes show the same sensitivity as expected from the same chromophores.

