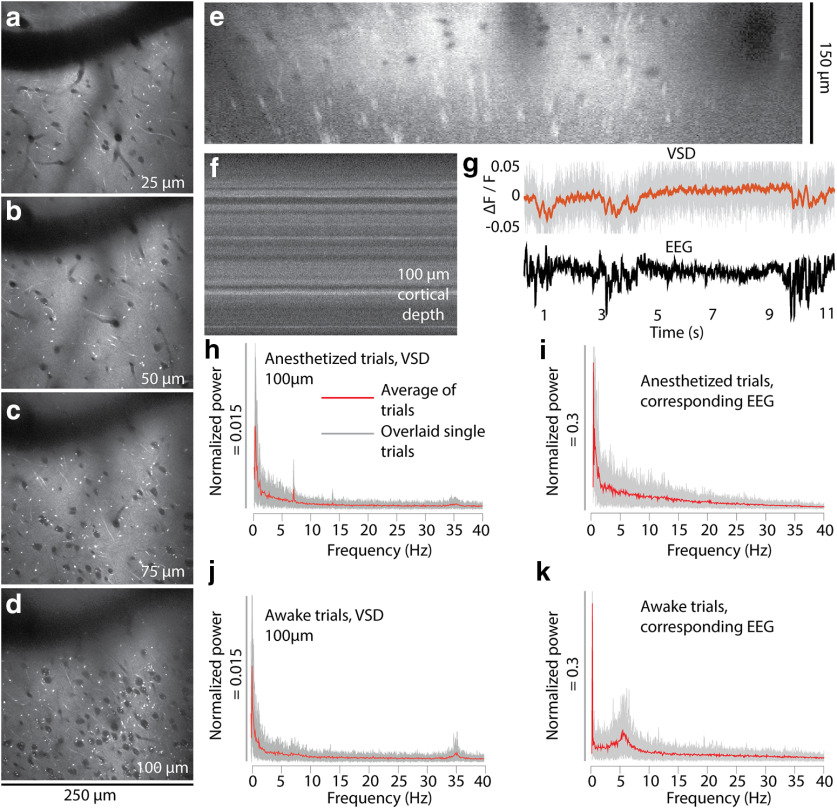
Figure 9.
In vivo two-photon imaging of cortical L1 and 2 after labeling with di1-ANNINE-6plus. a–e, Labeling with di1-ANNINE-6plus in vivo in different depths (a–d) and the corresponding x–z reconstruction (e). Bright spots indicate lipid-rich structures, most likely myelinated axons. f, g, Line-scan recordings (2 kHz recording; dwell time, 1 μs/pixel; f) and example of paired VSD and EEG recordings (g; 11 s anesthetized trace, 75 μm below dura; gray, raw VSD data; red, filtered recording; low-pass filtered at 30 Hz, eighth order; black, EEG) under isoflurane anesthesia showing spindle activity. h–k, Frequency spectra of membrane voltage and corresponding EEG recordings calculated from 30 recordings (11 s each; gray background, overlay of single trials; red line, average) in an awake and anesthetized mouse.

