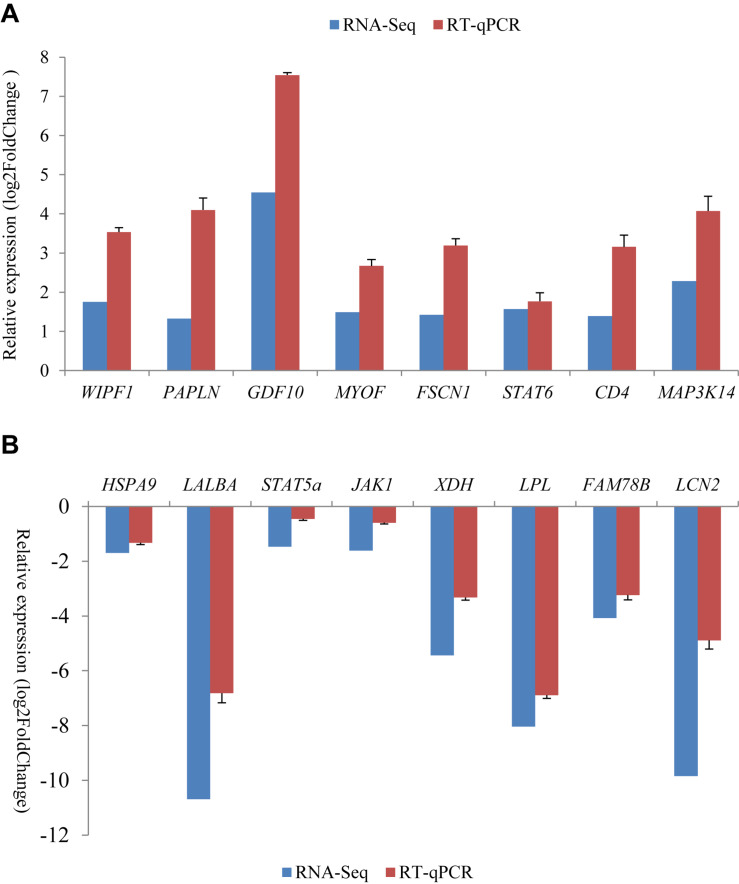
FIGURE 3.
Comparison of gene expression levels obtained by RNA-Seq, with those measured with RT-qPCR for 16 randomly selected differently expression genes (DEGs). These included eight up-regulated genes (A) and eight down-regulated genes (B) in the non-lactating period compared to peak-lactation. The RT-qPCR results are presented as mean ± SD for three replicates with the SD being shown in the error bars.

