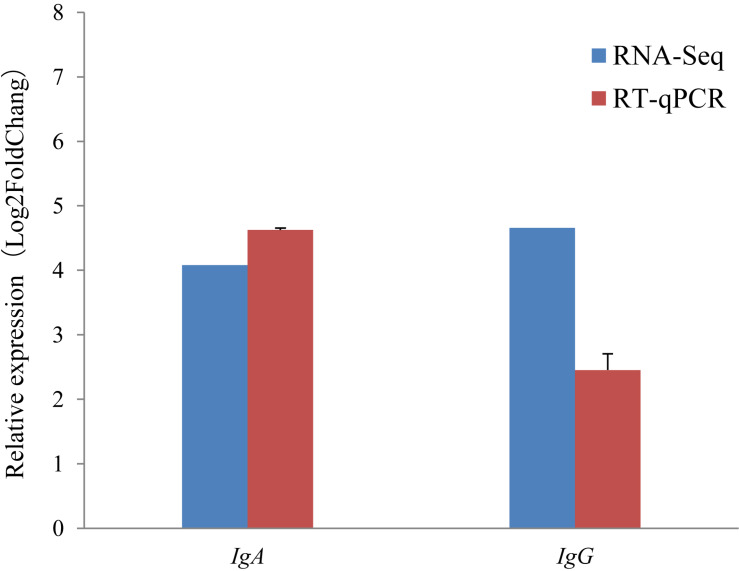
FIGURE 5.
Comparison of gene expression levels obtained with RNA-seq, with those measured with RT-qPCR for IgA, and IgG. The red colored bars show the mean for three replicates for each sample RT-qPCR and the error bars indicate standard deviation (SD). Fold change is the expression level in the non-lactating period divided by the expression level at peaking-lactation for the genes.

