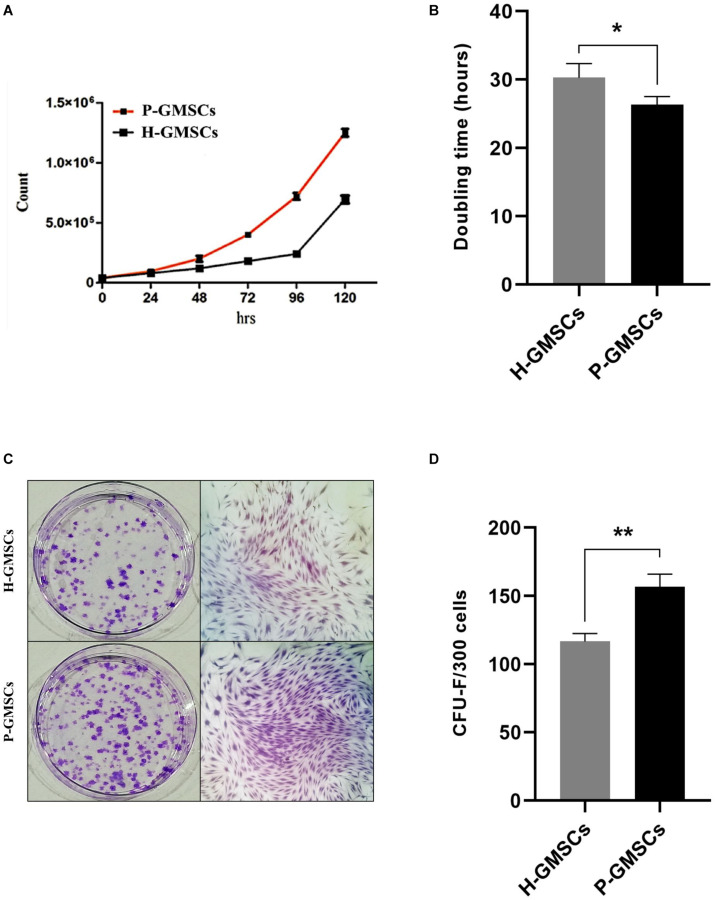
FIGURE 2.
Cell growth analysis and colony-forming unit assay. Panels (A) and (B) respectively show the cell growth curve of H-GMSCs and P-GMSCs (P2) evaluated by Trypan blue viability assay and the doubling time of H-GMSCs and P-GMSCs calculated according to the literature data (http://www.doublingtime.com/compute.php); Panels (C) and (D) respectively show the colonies (<50 cells) (left) and the monolayer subculture (right) of H-GMSCs and P-GMSCs (P1) stained with Crystal Violet, and the quantification histogram of the colony-forming unit assay (CFU-F); data are reported as mean values ± SD of three independent experiments. P-value *P ≤ 0.05; **P ≤ 0.01.

