Figure 1.

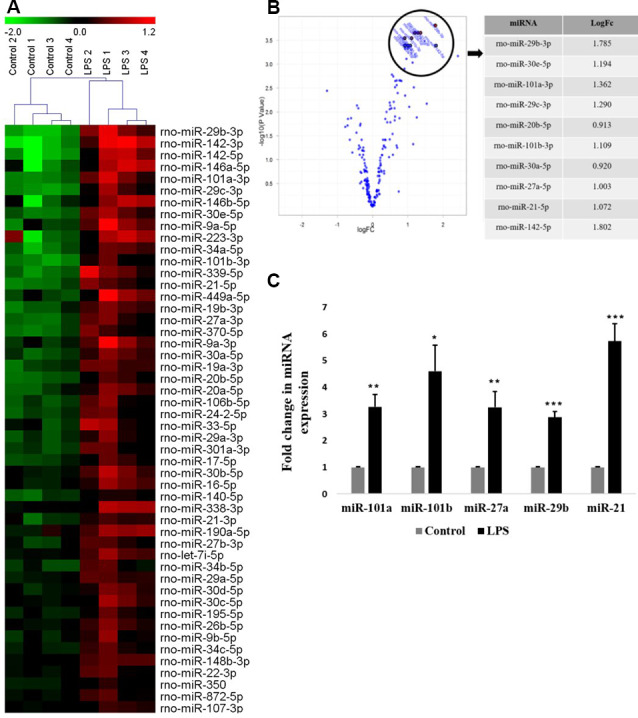
Global miRNA expression profiling shows the differential expression of miRNAs in activated microglia. (A) Heat map generated from microRNA microarray shows the result of differential miRNAs expression in control vs. lipopolysaccharide (LPS)-treated primary microglia. Each column represents a biological sample while each row represents a miRNA. The color scale represents the relative expression level of each miRNA in each sample as compared to the reference channel. Red color indicates an expression that is higher than the reference channel, while green color indicates an expression that is below the reference. (B) Volcano plot illustrating the relation between the logarithm of the p-values and the log fold change of miRNAs differentially expressed in control and LPS-activated microglia. The top selected miRNAs are marked with annotation on the plot and tabulated on the right. (C) Quantitative RT-PCR analysis of few differentially expressed miRNAs found in miRNA microarray in Control vs. LPS activated primary microglia. Results are represented as fold change for untreated controls. Statistical analysis was carried out using ANOVA with post hoc Tukey test. Data represented as mean ± SD, (n = 5), ***p < 0.001; **p < 0.01; *p < 0.05.
