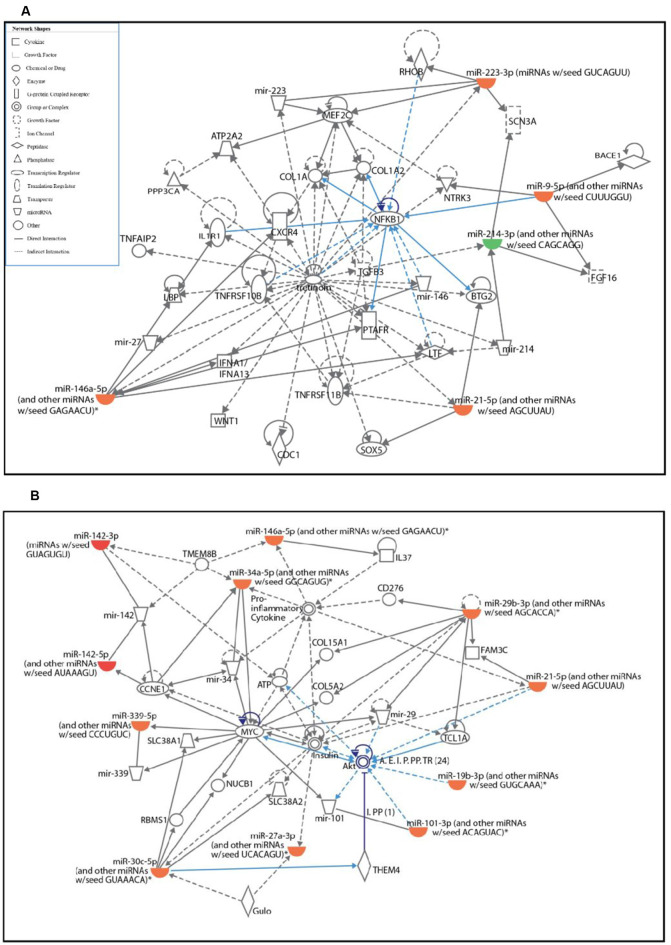
Figure 2.
Ingenuity pathway analysis (IPA) analysis of differentially expressed miRNAs in activated primary microglia compared to control microglial cells. (A,B) IPA showing up- (red) and down-regulation (green) of miRNAs and their target gene networks such as NF-κB (A) and Akt (B) in LPS-activated primary microglial cells when compared to control.

