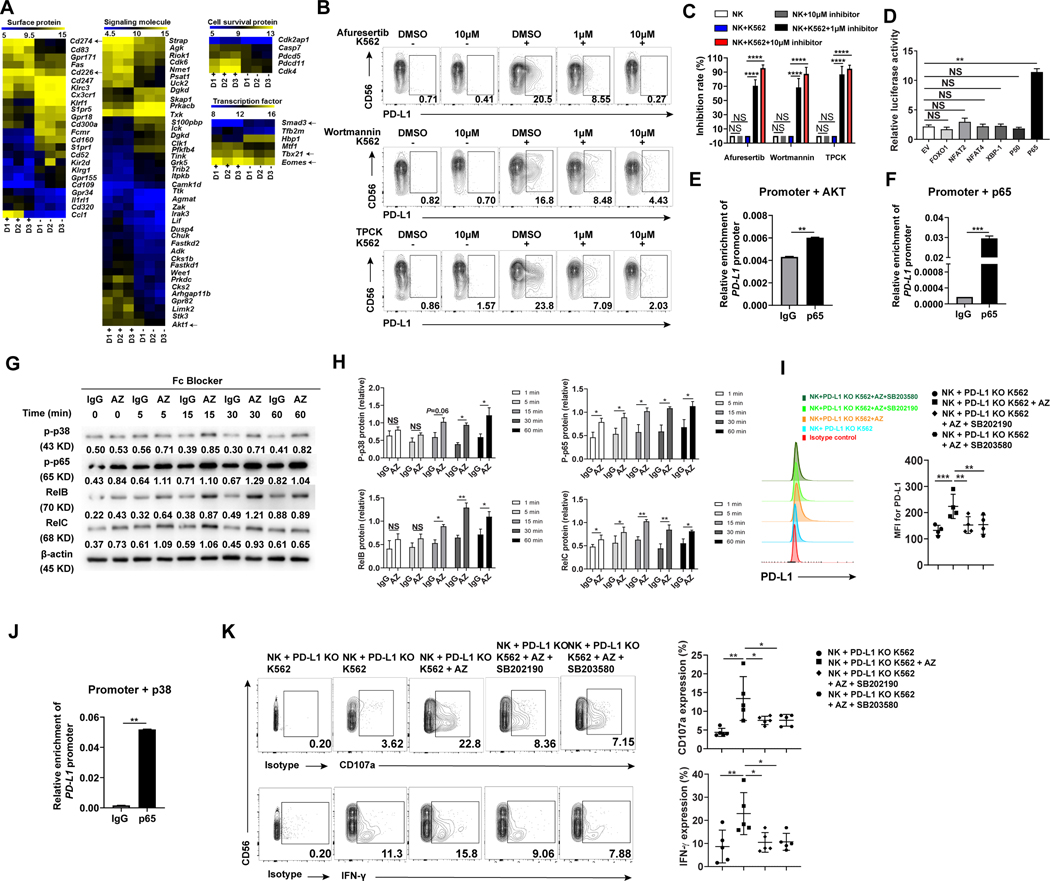
Fig. 6.
Signaling pathways involved in the anti-PD-L1 antibody-induced NK cell activation in the presence of tumor cells. (A) Gene expression profile using RNA microarray of PD-L1− and PD-L1+ NK cells sorted from K562 and IL-2-stimulated enriched NK cells of three healthy donors (D1, D2 and D3). “D1+” represents PD-L1+ NK cells from donor 1, while “D1-” represents PD-L1− NK cells from donor 1, each purified by FACS sorting. Similar definitions are applied to “D2+”, “D2-”, “D3+”, and “D3-”. Expression of Cd274 (PD-L1), Cd226 (DNAM-1), Tbx21, Eomes, Smad3, and Akt1 were highlighted by black arrows. (B) NK cells were incubated without or with K562 cells in the absence or presence of the AKT-pan inhibitor Afureserlib, the PI3K-specific inhibitor wortmannin or the P65-specific inhibitor TPCK at a concentration of 1μM or 10 μM. The percentages of PD-L1+ NK cells were measured by flow cytometry. (C) Inhibition rate of PD-L1+ NK cells was measured as the relative proportion of PD-L1+ cells in each treatment condition compared to untreated control (no inhibition) (n = 5). (D) 293 T cells were transfected with the PD-L1 promoter and the indicated expression plasmids. Relative promoter activity was measured by luciferase assay after 48 h. (E and F) The chromatin immunoprecipitation (ChIP) assay was employed to assess the binding of p65 to the PD-L1 promoter when (E) AKT or (F) p65 was overexpressed. The experiments were repeated three times. (G and H) Representative and summary data (n = 3) showing the activity of p38 and NF-κB family members including p65 (RelA), RelB, and RelC in NK cells incubated with IL-2 plus PD-L1 KO K562 cells for 20 h and then with the anti-PD-L1 mAb AZ or IgG for various periods as indicated. Fc blocker was added 15 min prior to adding IgG or AZ antibodies to minimize ADCC effect. Total PD-L1 protein was measured by immunoblotting. Numbers beneath each lane represents relative density quantified by Image J software, normalized for equivalent loading as determined by β-actin. Increased phosphorylation of some members by AZ at 0 min likely due to the activation of the cells by AZ during sample harvesting. Linear mixed model was used to assess the treatment × time interaction and group difference IgG vs AZ at each time point by accounting for the repeated measures from the same donor. (I) Flow cytometry to measure PD-L1 expression on NK cells incubated with PD-L1 KO K562 cells for 20 h and then with the anti-PD-L1 mAb AZ in the absence or presence of 1 μM p38 inhibitor SB202190 or SB203580 for 4 h (n = 4). (J) The chromatin immunoprecipitation (ChIP) assay was employed to assess binding of p65 to the PD-L1 promoter in 293 T cells transduced with p38 for 24 h using a p65 or IgG antibody. The experiments were repeated three times. (K) Representative example and summary data (n = 5) quantifying the expression of CD107a and IFN-γ in NK cells following their incubation with K562 cells for 24 h and then with the anti-PD-L1 mAb AZ in the absence or presence of 1μM p38 inhibitor SB202190 or SB203580. Two paired groups were compared by paired t test. Paired t test (E, F and J) was used for two-group comparisons and one-way ANOVA with repeated measures for donor-matched 3 or more groups (C, D, I, and K). P values were adjusted by the Holm-Sidak method. *, P < 0.05; **, P < 0.01; ***, P < 0.001; ****, P < 0.0001; NS, not significant.

