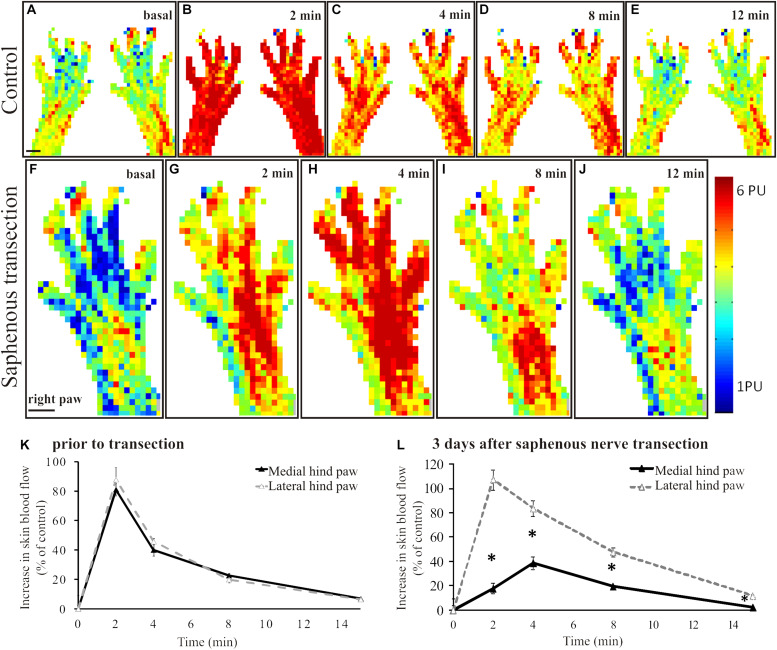
FIGURE 1.
A–E: Original perfusion images recorded with the scanning laser Doppler flowmeter illustrating the time course and spatial distribution of the vasodilatatory response elicited by the epicutaneous application of mustard oil onto the dorsal skin of the hindpaws of a control rat. Note the increase in blood flow of similar magnitude in the medial and lateral regions of the hindpaw skin. The line graph (K) depicts the time course of the increase in cutaneous blood flow relative to baseline value. Filled and empty triangles represent values measured in the medial (saphenous innervated) and lateral (sciatic innervated) skin areas, respectively (n = 6). F–J: Original perfusion images recorded with the scanning laser Doppler flowmeter illustrating the reduced mustard oil-induced vasodilatation in the medial aspect of the dorsal hindpaw skin three days after transection of the saphenous nerve. The line graph (L) shows the time course of the vasodilatatory response in the medial (filled triangles) and lateral (empty triangles) aspects of the dorsal hindpaw skin (*p < 0.05; n = 6). Scale bar on A and F represents 5 mm.

