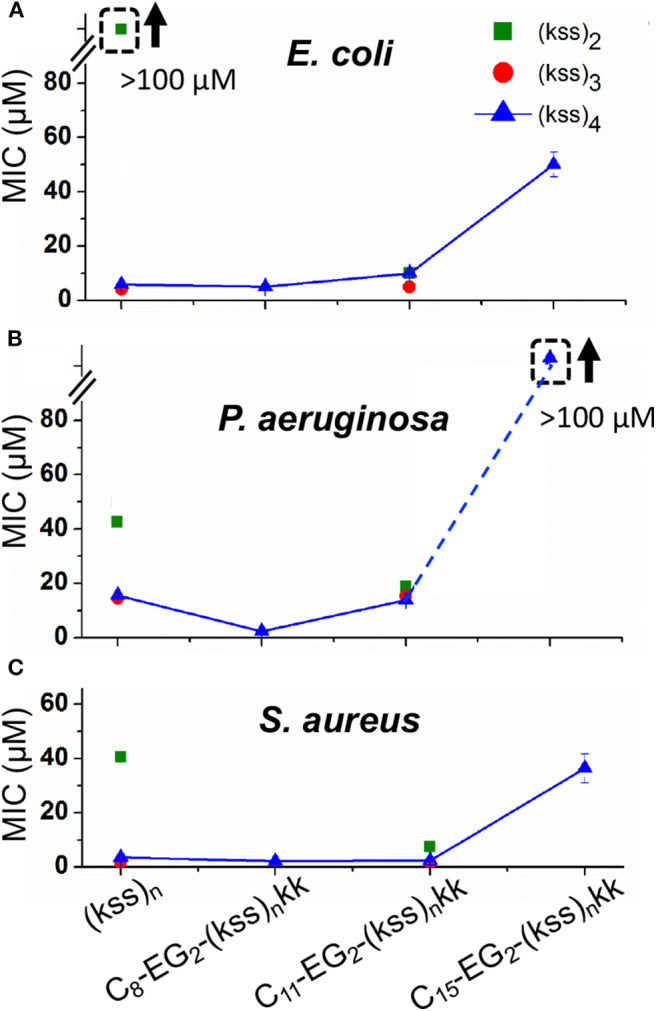
Figure 6.

MICs against E. coli (A), P. aeruginosa. (B), and S. aureus (C) measured for C8-EG2-(kss)n-kk lipopeptoids with increasing tail length C8, C11, and C15, and different lengths of the (kss)n motif. Values measured for “unfunctionalized” (kss)n peptoids are also shown. The legend in panel A applies to all data. The error bars denote ± 1 SD (standard deviation). Bounded boxes with an up arrow denote that no significant inhibition was observed up to the maximum tested 100 μM—the actual MICs could be significantly higher. Dashed lines highlight the corresponding data points in a series.
