Figure 2.
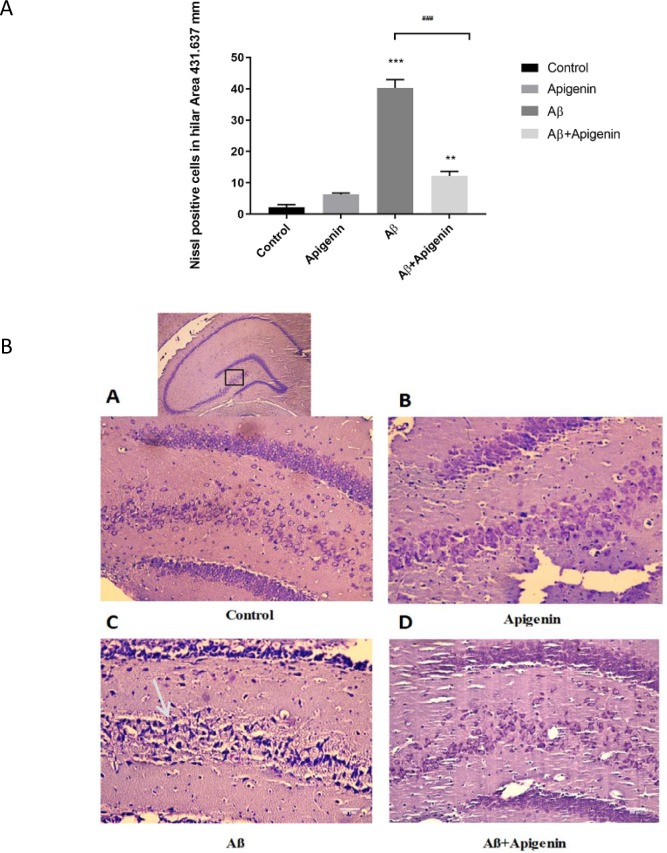
A. Representative bars of quantitative analysis of the necrotic cells of the hilus area. Apigenin significantly ameliorated the necrotic effect of Amyloid Beta (Aβ) in hilus (P<0.001 compared with Aβ group).
Values are presented as Mean±SE (n=4).
*** P<0.001 and ** P<0.01 vs. control group; ### P<0.001 vs. Aβ group.
B. a. Representative photomicrographs of Nissl-stained brain sections of the hilus area of the control; b. Apigenin; C. Amyloid beta (Aβ); and D. Aβ+apigenin groups.
The lower magnification is presented above. Severe cell loss is evident in the Aβ group (arrow), which remarkably conserved after apigenin treatment.
Scale bar for A–D: 50 μm (n=4).

