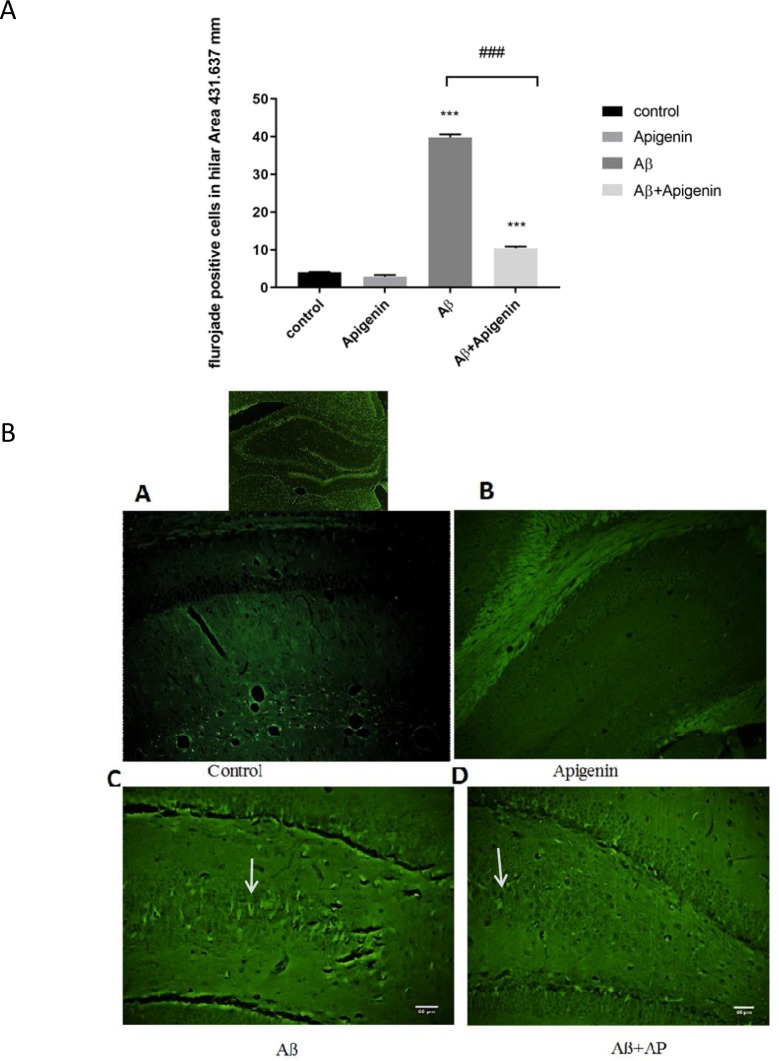
Figure 3.
A. Representative bar graphs showing quantitative analysis of degenerative cells in the hilus area stained by Fluoro-Jade B (FJB). A significant reduction in the number of FJB-positive cells is evident following treatment with apigenin. Values are expressed as Mean±SE. ### P < 0.001 vs. amyloid beta (Aβ) group (n=4).
B. a. Representative FJB-labeled sections taken from the control b), apigenin; c. Aβ d. and Aβ+apigenin groups 30 days after surgery.
No FJB-positive cells were apparent in the control tissue. FJB-positive cells were evident in the Aβ group (indicated by arrows).
FJB labeling was significantly decreased after treatment with apigenin (d). Scale bar=50 μm (a–d) (n=4).

