Figure 4.
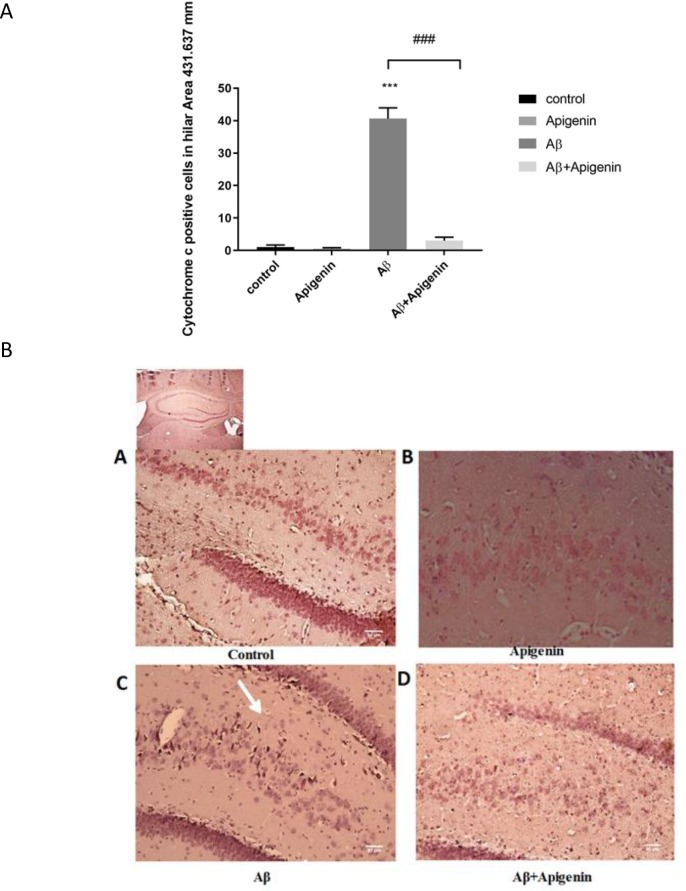
A. a. Bar chart showing quantification of immunohistochemically labeled of cytochrome c-positive cells in the hilus area of the hippocampus in the control; b. Apigenin; c. Amyloid Beta (Aβ); and d. Aβ+apigenin groups.
A significant reduction in the number of cytochrome c-positive cells is evident following treatment with apigenin. Values are expressed as Mean±SE (n=4).
### P<0.001 Aβ vs. Aβ+apigenin group; *** Aβ vs. control group
B. a. Photomicrograph of representative immunohistochemistry of cytochrome c-stained sections prepared from the control b. Apigenin; c. Amyloid beta (Aβ); and d. Aβ+Apigenin groups.
Apigenin almost completely blocked the release of cytochrome c in the hilar area. Scale bar=50 μm (A–D) (n=4).

