
Figure 4: Survival analysis of BC patients by gene expression of the IL-12/STAT4 axis downstream and regulators components.
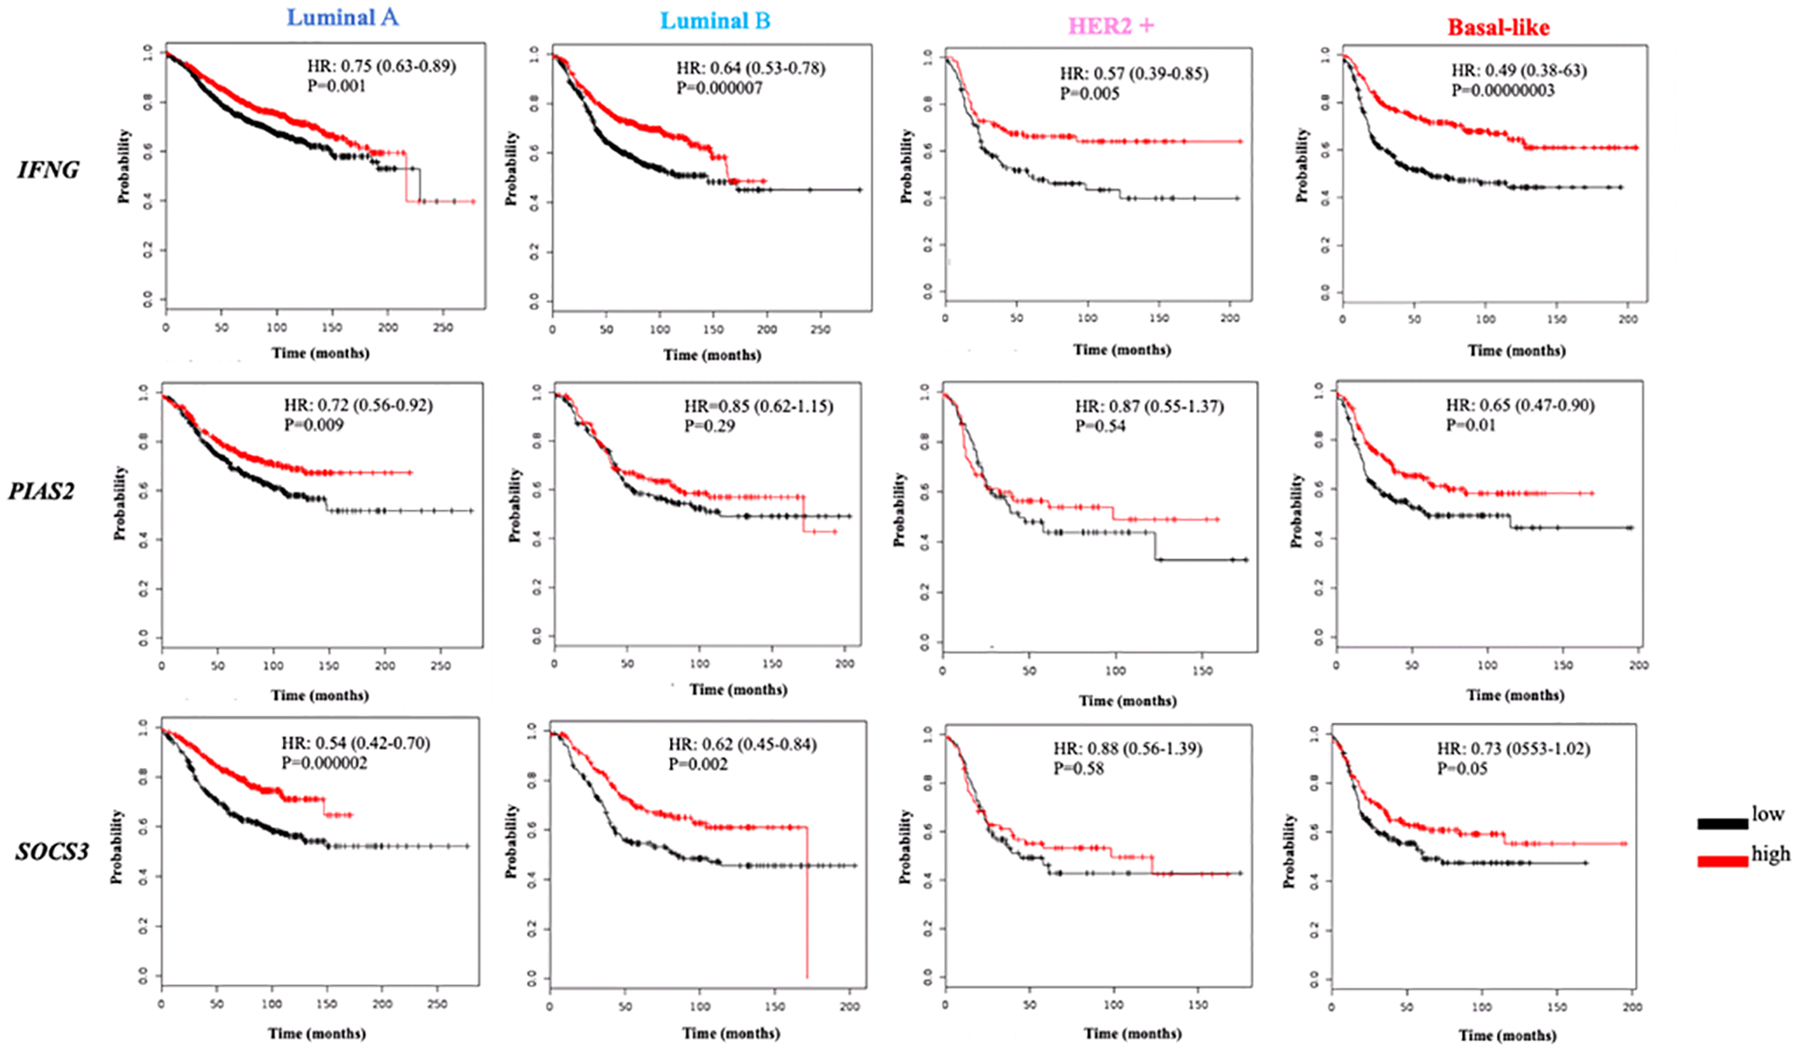
Kaplan Meier plots of the IFNG, PIAS2 and SOCS3 genes expression and BC survival stratified by BC subtypes (Luminal A, Luminal B, HER2+ and Basal-like). The red line represents a higher expression, whereas the black line represents lower gene expression. Y-axis represents survival probability whereas x-axis the time (in months). HR: Hazards ratio; P: p-value.