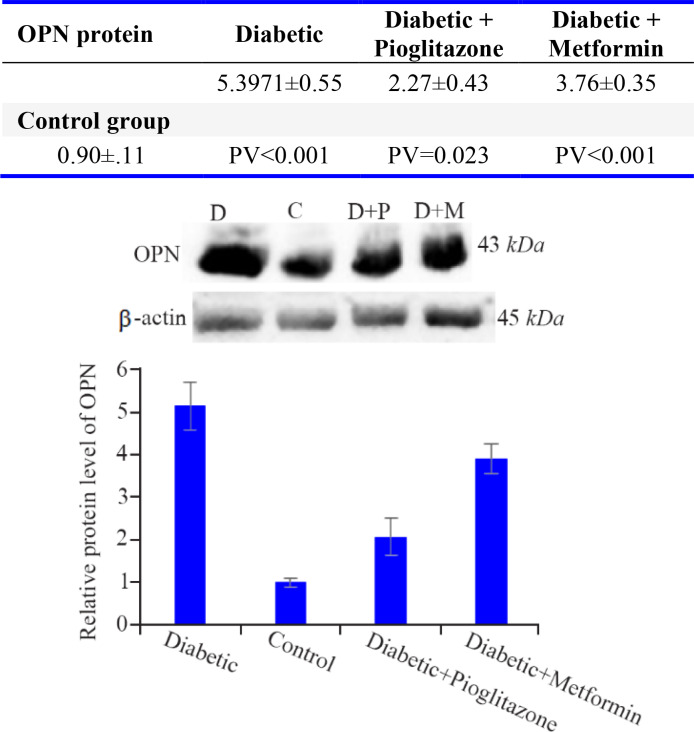
Figure 1.
Comparison of OPN protein levels in the rat endometrium at the time of embryo implantation. All values were presented as mean±SEM. Error bars represent standard error of mean. p<0.05 was considered statistically significant. Data analysis reveals that significant differences were observed between all four groups. In western blot image, D=diabetic control, C=control group, D+P=diabetic rats treated with pioglitazone and D+M=diabetic rats treated with metformin

