
Figure 1.
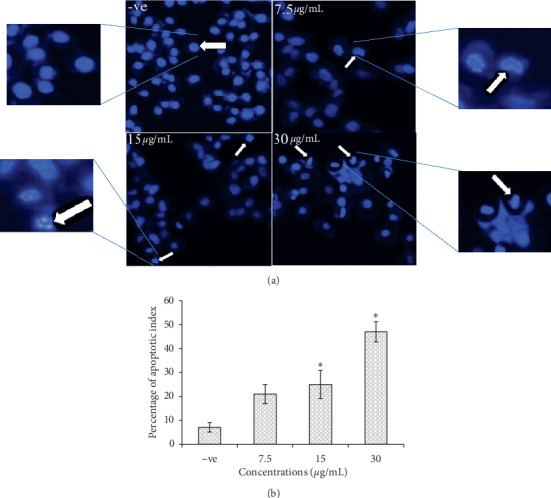
(a) MCF-7 cells in Hoechst stain demonstrate the normal morphology in the negative control (−ve) and the morphological changes in treated cells at different concentrations of EHX: kidney shape, apoptotic body, and cell shrinkage. Magnification is 20x. (b) Percentage of the apoptotic index at concentrations of 7.5, 15, and 30 μg/mL. Values are mean ± SD. ∗p < 0.05.