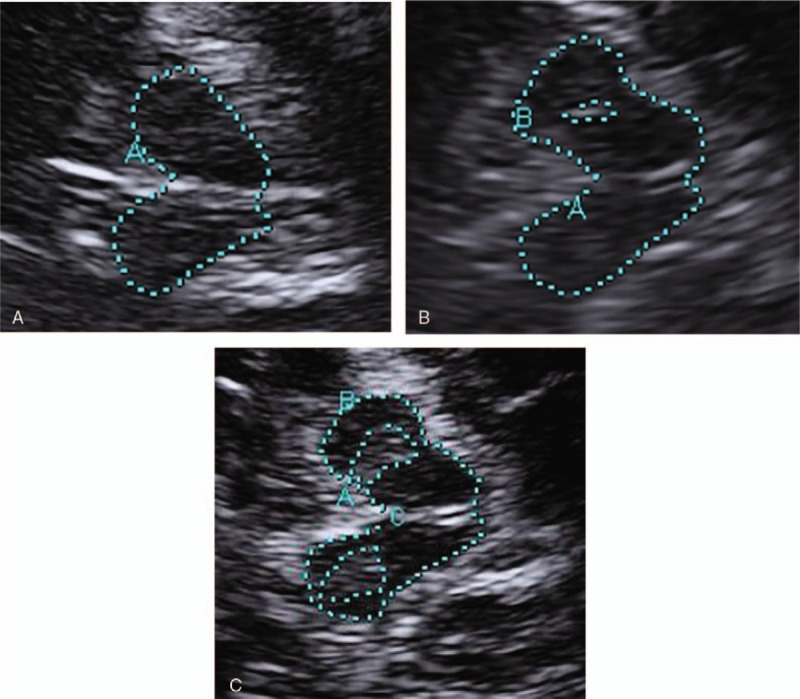
Figure 2.

Transcranial sonographic images of the midbrain. (A) Image of normal SN echogenicity in healthy control. (B) Image of substantia nigra (SN) hyperechogenicity in Essential tremor patients. (C) Image of SN hyperechogenicity in Parkinson disease patient. In the graph, A represent midbrain area. The echogenic region of the substantia nigra is encircled with dotted line for better visualization (B and C).
