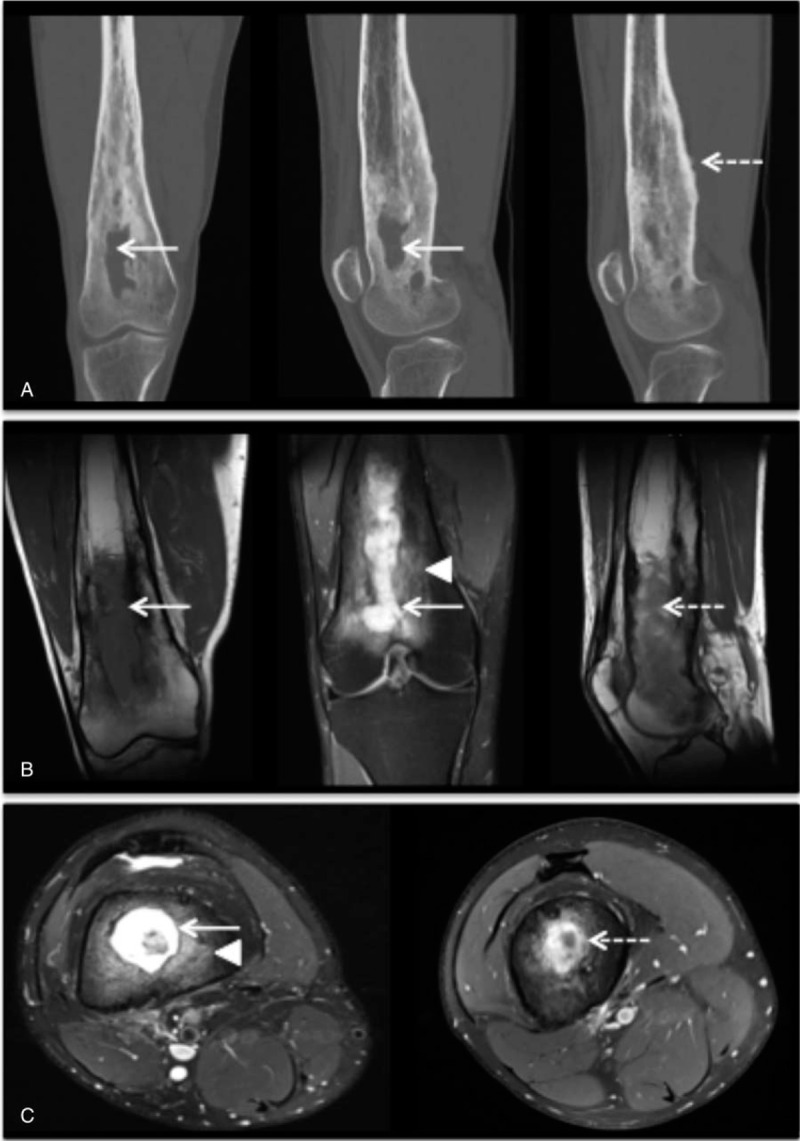
Figure 2.

Osteomyelitis with intraosseous abcess. (A) Tomodensitometry of the right thigh, note a medullary defect (arrow), thickening of the cortex and periosteal reaction (dashed arrow). (B) Magnetic resonance imaging of the right thigh (from left to right), note a low-signal medullary image in T1-weighted sequence (arrow); hyperintensity medullary image (arrow) and bone marrow oedema (arrowhead) in T2-weighted sequence with fat suppression; and in T1-weighted post contrast image the heterogen enhancement associated with the intraosseous abscess (dashed arrow). (C) Magnetic resonance imaging of the right thigh (from left to right), T2-weighted fat suppressed image shows intraosseous abscess cavity (arrow) with rim of surrounding oedema (arrowhead); T1-weighted post contrast image with fat suppression shows peripherical enhancement associated with the intraosseous abscess (dashed arrow).
