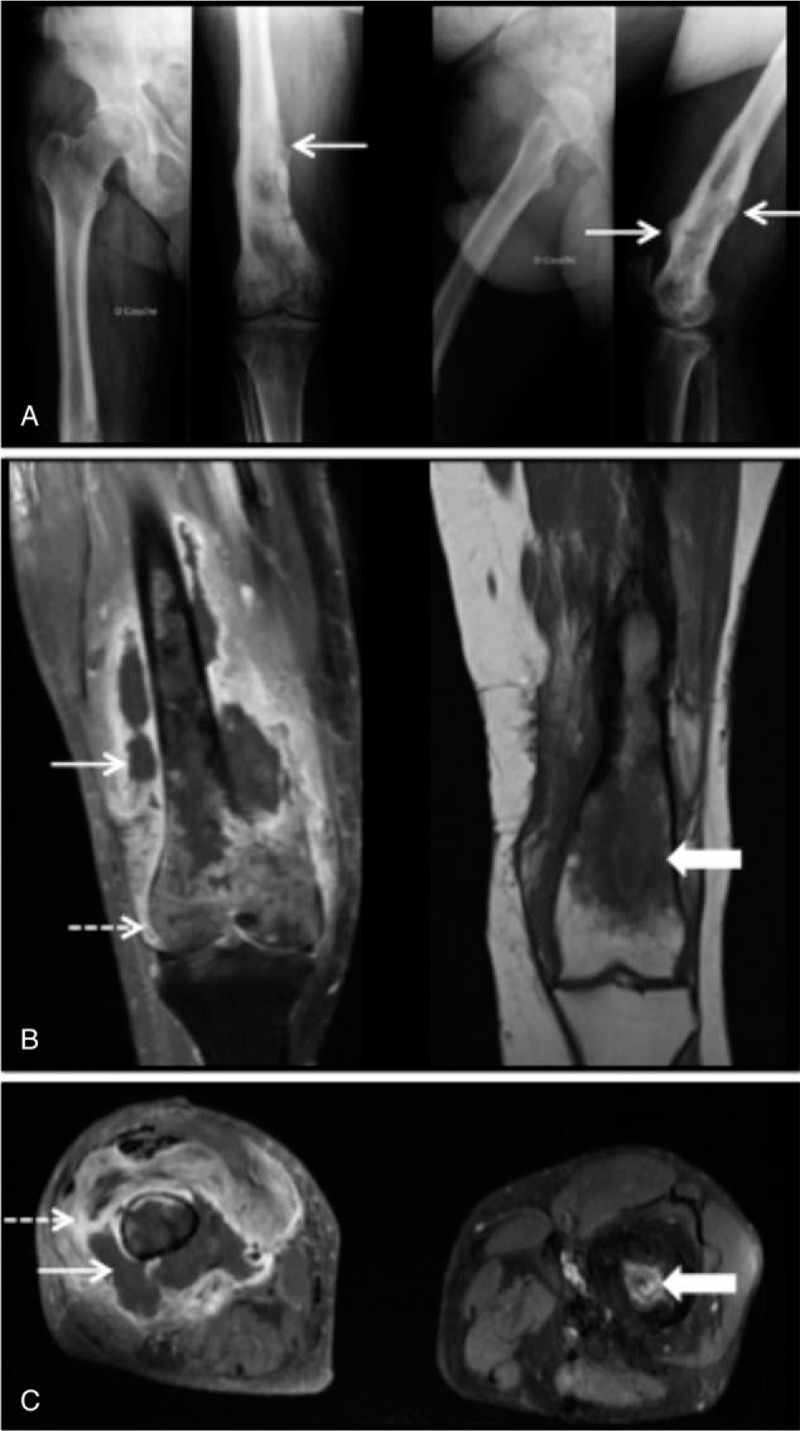
Figure 3.

Right femoral osteomyelitis and left chronic femoral osteomyelitis. (A) Anteroposterior and lateral X-rays of the right femur, note periosteal reaction (arrow) and sclerotic areas. (B) (from left to right) Coronal magnetic resonance imaging in T1-weighted post contrast with fat suppression of the right femur, shows osteomyelitis complicated by a soft tissue abscess (arrow) and an arthritis (dashed arrow); Coronal magnetic resonance imaging, in T1-weighted post contrast of the left femur, shows chronic osteomyelitis and a marrow oedema (large arrow). (C) Axial magnetic resonance imaging of the right and the left femur, in T1-weighted post contrast with fat suppression, shows soft tissue fluid collection (arrow) and inflammation around the lesion (dashed arrow) to the right femur and intraosseous abscess to the left femur (large arrow).
