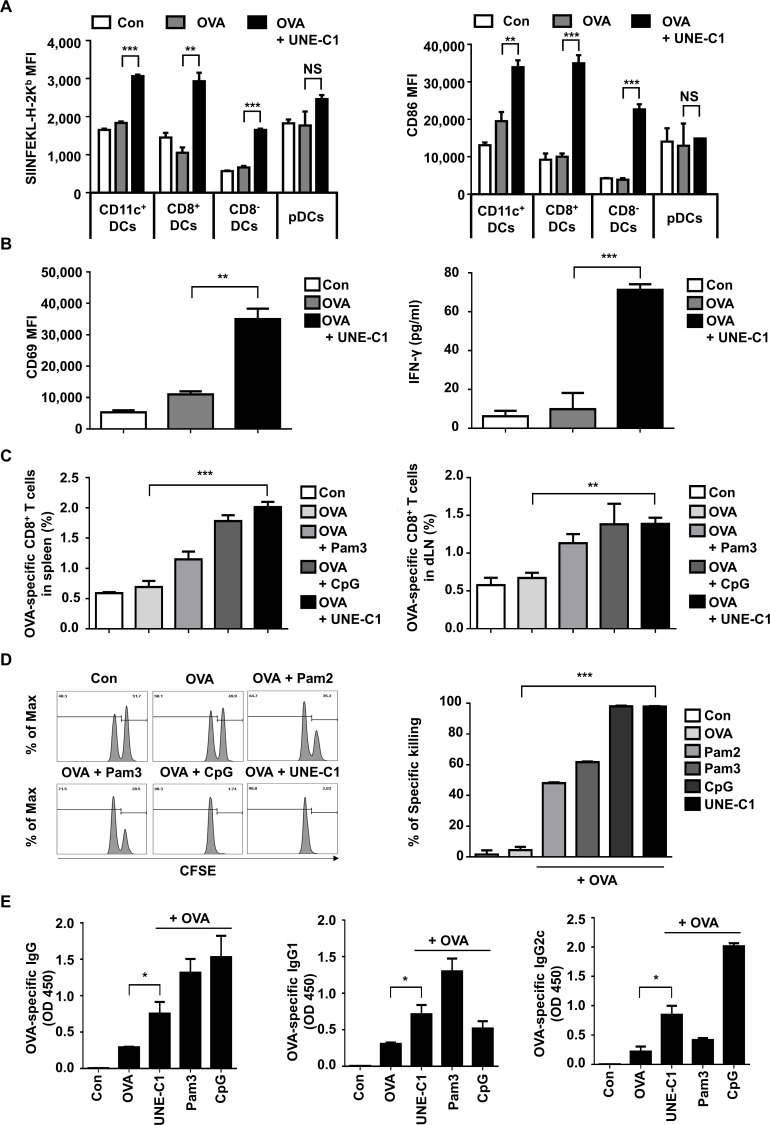
Figure 4.
UNE-C1-dependent stimulation of humoral and cellular immune responses in vivo. (A) C57BL/6 mice (n=3) were injected subcutaneously with indicated reagents. A day after, dLNs were collected, and antigen presentation on h-2kb and CD86 in a different subset of DCs was quantified. (B) After immunizing mice (n=3), pan-DCs of each group were collected from its dLNs and spleens. Collected DCs were cocultured with CD8+ T cells from OT-1 transgenic mice for 24 hours. Expression levels of CD69 on OT-1 T cells were quantified and the production of IFN-γ in the supernatants was measured by ELISA. (C) Indicated reagents were used for mice (n=5) immunization on days 0 and 7. Seven days after the last immunization, spleens and dLNs were collected from immunized mice. Percentages of OVA-specific CD8+ T cells in the spleens and dLNs were measured. (D) Mice (n=3) were immunized on days 0 and 7. On day 14, mice were injected intravenously with SIINFEKL peptide-pulsed and unpulsed splenocytes labeled with a high or low concentration of CFSE, respectively. After 24 hours, the percentage of antigen-specific killing was measured by flow cytometry. Representative flow cytometry plots showing remained pulsed and unpulsed cells from immunized mice, and bar diagram with quantitative comparison. (E) Seven days after the final immunization, the serum was collected from each group of mice (n=5), and OVA-specific total IgG, IgG1, and IgG2c were measured by ELISA. Data are representative of three independent experiments. Results are presented as mean±SEM, and statistical significance was analyzed with Student’s t-test (*p<0.05, **p<0.01, ***p<0.001). CFSE, carboxyfluorescein succinimidyl ester; DC, dendritic cell; dLN, draining lymph node; IFN-γ, interferon gamma; MFI, mean fluorescence intensity; OVA, ovalbumin; pDC, plasmacytoid dendritic cell.

