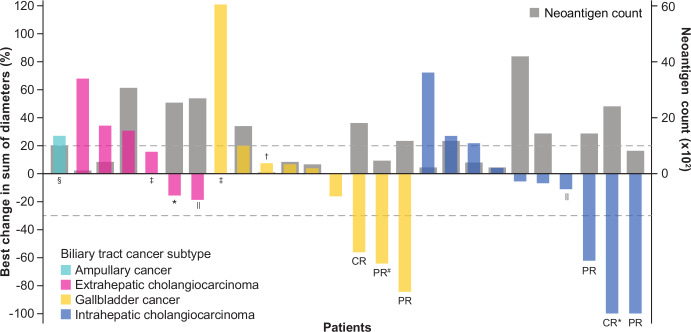
Figure 2.
Change in target lesions from baseline as adjudicated by the IRC. Responses were assessed in accordance with Response Evaluation Criteria in Solid Tumors (RECIST) version 1.1. The upper dotted line represents progression at 20% increase in size of target lesions, and the lower dotted line represents the RECIST boundary for complete response or partial response at 30% decrease in size of target lesions. Patients with no postbaseline assessment (n=2) or no target lesions identified by the IRC before first dose (n=2) are not displayed. *Patients with MSI-H phenotype. †MSI phenotype not available due to no leftover sample. ‡Patients with unavailable tumor mutation count data. §Patient with poststudy tumor shrinkage of non-target lesions. ‖Patients with an investigator-assessed best overall response of partial response. #Patient with a partial response following pseudoprogression per investigator assessment (best overall response per investigator, progressive disease). CR, complete response; MSI-H, microsatellite instability-high; PR, partial response.

