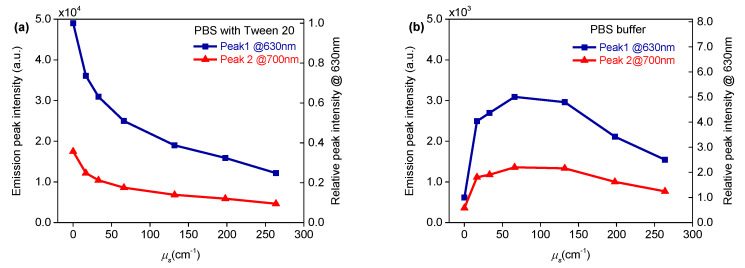
Figure 5.
PpIX fluorescence peak intensity at ~630 nm (blue line) and ~700 nm (red line) plotted as a function of scattering coefficient (left y-axis). Relative emission intensities at 630 nm of PpIX samples containing different concentrations of scatterer, compared with that containing no scatterer as a function of scattering coefficient (right y-axis). (a) in PBS buffer containing Tween 20 and (b) PBS buffer containing no surfactant.

